

Cortical and subcortical contributions to absence seizure onset examined with EEG/fMRI
- PMID: 20580319
- PMCID: PMC2922486
- DOI: 10.1016/j.yebeh.2010.05.009
Cortical and subcortical contributions to absence seizure onset examined with EEG/fMRI
Abstract
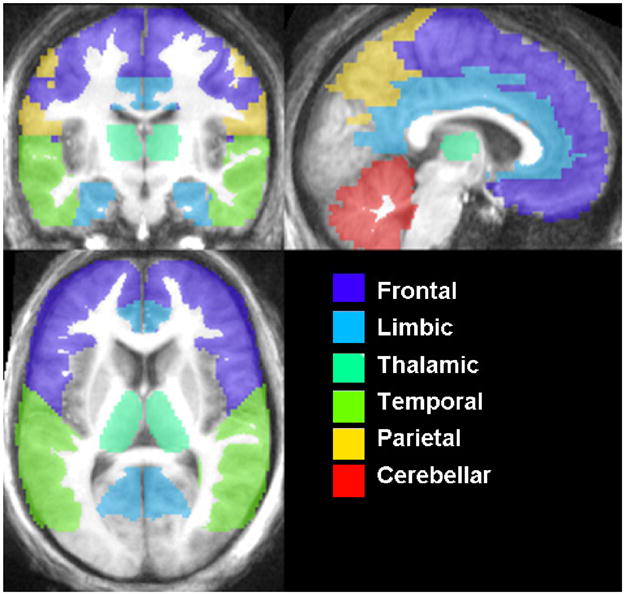
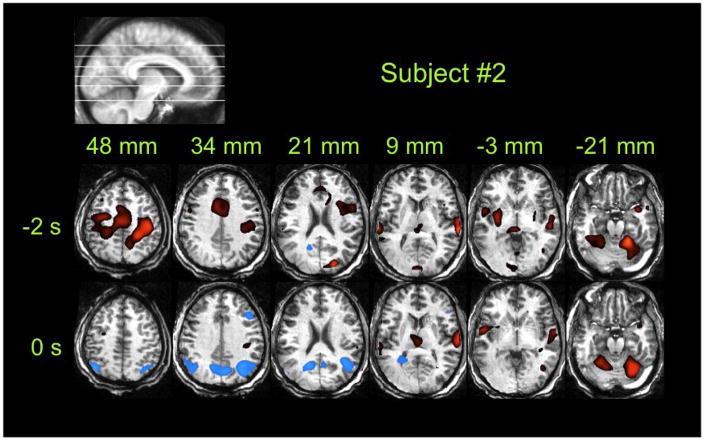
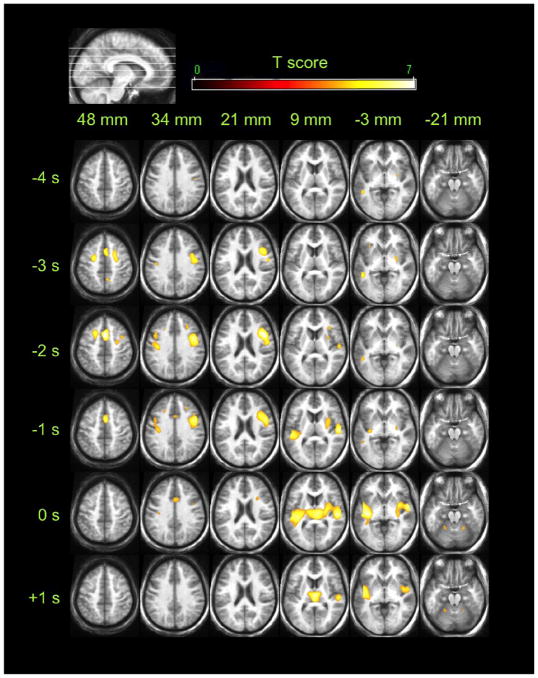
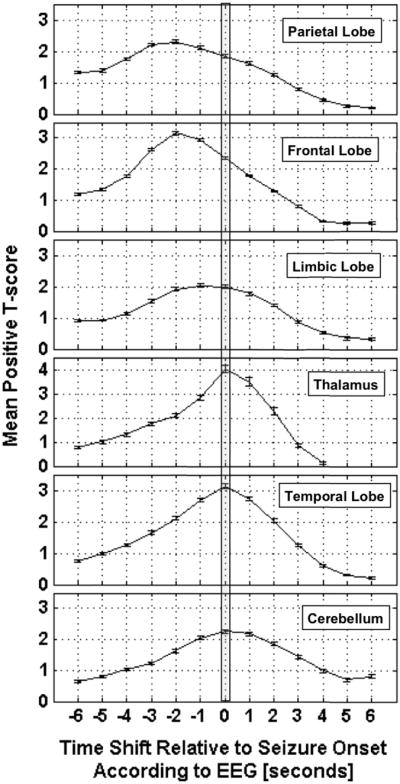
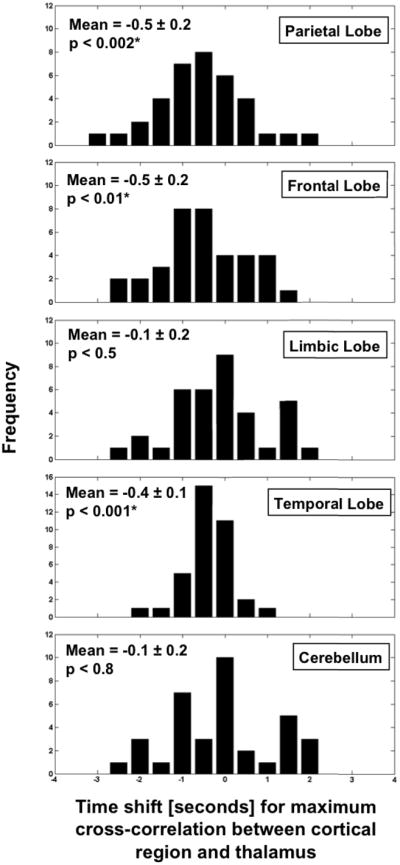
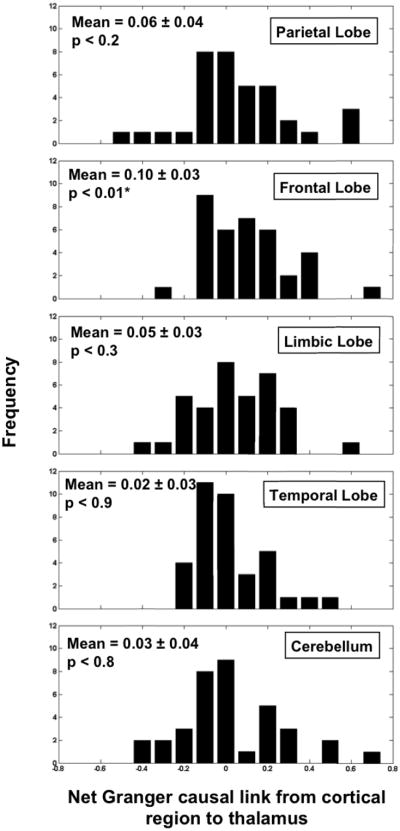
In patients with idiopathic generalized epilepsies (IGEs), bursts of generalized spike and wave discharges (GSWDs) lasting > or =2 seconds are considered absence seizures. The location of the absence seizures generators in IGEs is thought to involve interplay between various components of thalamocortical circuits; we have recently postulated that medication resistance may, in part, be related to the location of the GSWD generators [Szaflarski JP, Lindsell CJ, Zakaria T, Banks C, Privitera MD. Epilepsy Behav. 2010;17:525-30]. In the present study we hypothesized that patients with medication-refractory IGE (R-IGE) and continued absence seizures may have GSWD generators in locations other than the thalamus, as typically seen in patients with IGE. Hence, the objective of this study was to determine the location of the GSWD generators in patients with R-IGE using EEG/fMRI. Eighty-three patients with IGE received concurrent EEG/fMRI at 4 T. Nine of them (aged 15-55) experienced absence seizures during EEG/fMRI and were included; all were diagnosed with R-IGE. Subjects participated in up to three 20-minute EEG/fMRI sessions (400 volumes, TR=3 seconds) performed at 4 T. After removal of fMRI and ballistocardiographic artifacts, 36 absence seizures were identified. Statistical parametric maps were generated for each of these sessions correlating seizures to BOLD response. Timing differences between brain regions were tested using statistical parametric maps generated by modeling seizures with onset times shifted relative to the GSWD onsets. Although thalamic BOLD responses peaked approximately 6 seconds after the onset of absence seizures, other areas including the prefrontal and dorsolateral cortices showed brief and nonsustained peaks occurring approximately 2 seconds prior to the maximum of the thalamic peak. Temporal lobe peaks occurred at the same time as the thalamic peak, with a cerebellar peak occurring approximately 1 second later. Confirmatory analysis averaging cross-correlation between cortical and thalamic regions of interest across seizures corroborated these findings. Finally, Granger causality analysis showed effective connectivity directed from frontal lobe to thalamus, supporting the notion of earlier frontal than thalamic involvement. The results of this study support our original hypothesis and indicate that in the patients with R-IGE studied, absence seizures may be initiated by widespread cortical (frontal and parietal) areas and sustained in subcortical (thalamic) regions, suggesting that the examined patients have cortical onset epilepsy with propagation to thalamus.
Copyright 2010 Elsevier Inc. All rights reserved.
Figures
Similar articles
-
Increased cortical BOLD signal anticipates generalized spike and wave discharges in adolescents and adults with idiopathic generalized epilepsies.Epilepsia. 2012 Apr;53(4):622-30. doi: 10.1111/j.1528-1167.2011.03385.x. Epub 2012 Jan 13. Epilepsia. 2012. PMID: 22242887
-
An EEG-fMRI Study on the Termination of Generalized Spike-And-Wave Discharges in Absence Epilepsy.PLoS One. 2015 Jul 8;10(7):e0130943. doi: 10.1371/journal.pone.0130943. eCollection 2015. PLoS One. 2015. PMID: 26154563 Free PMC article.
-
Functional connectivity in patients with idiopathic generalized epilepsy.Epilepsia. 2011 Mar;52(3):515-22. doi: 10.1111/j.1528-1167.2010.02938.x. Epub 2011 Jan 26. Epilepsia. 2011. PMID: 21269293 Free PMC article.
-
[EEG-fMRI studies on the neural networks of the generalized spike and wave discharges: an overview].Sheng Wu Yi Xue Gong Cheng Xue Za Zhi. 2012 Feb;29(1):179-83. Sheng Wu Yi Xue Gong Cheng Xue Za Zhi. 2012. PMID: 22404034 Review. Chinese.
-
Spike-wave discharges in adult Sprague-Dawley rats and their implications for animal models of temporal lobe epilepsy.Epilepsy Behav. 2014 Mar;32:121-31. doi: 10.1016/j.yebeh.2014.01.004. Epub 2014 Feb 15. Epilepsy Behav. 2014. PMID: 24534480 Free PMC article. Review.
Cited by
-
Multifrequency Dynamics of Cortical Neuromagnetic Activity Underlying Seizure Termination in Absence Epilepsy.Front Hum Neurosci. 2020 Jun 26;14:221. doi: 10.3389/fnhum.2020.00221. eCollection 2020. Front Hum Neurosci. 2020. PMID: 32670039 Free PMC article.
-
Differences in paracingulate connectivity associated with epileptiform discharges and uncontrolled seizures in genetic generalized epilepsy.Epilepsia. 2014 Feb;55(2):256-63. doi: 10.1111/epi.12486. Epub 2014 Jan 21. Epilepsia. 2014. PMID: 24447031 Free PMC article.
-
Nonconvulsive Status Epilepticus With Generalized Spike-and-Wave Discharges: Pathophysiological and Nosological Considerations.Cureus. 2023 Oct 20;15(10):e47401. doi: 10.7759/cureus.47401. eCollection 2023 Oct. Cureus. 2023. PMID: 37869047 Free PMC article.
-
Dexmedetomidine, an alpha 2A receptor agonist, triggers seizures unilaterally in GAERS during the pre-epileptic phase: does the onset of spike-and-wave discharges occur in a focal manner?Front Neurol. 2023 Dec 11;14:1231736. doi: 10.3389/fneur.2023.1231736. eCollection 2023. Front Neurol. 2023. PMID: 38146441 Free PMC article.
-
EEG/fMRI contributions to our understanding of genetic generalized epilepsies.Epilepsy Behav. 2014 May;34:129-35. doi: 10.1016/j.yebeh.2014.02.030. Epub 2014 Mar 25. Epilepsy Behav. 2014. PMID: 24679893 Free PMC article. Review.
References
-
- Hauser WA, Annegers JF, Kurland LT. Incidence of epilepsy and unprovoked seizures in Rochester, Minnesota: 1935–1984. Epilepsia. 1993;34(3):453–68. - PubMed
-
- Loiseau P, Duche B, Loiseau J. Classification of epilepsies and epileptic syndromes in two different samples of patients. Epilepsia. 1991 May–Jun;32(3):303–9. - PubMed
-
- Murthy JM, Yangala R, Srinivas M. The syndromic classification of the International League Against Epilepsy: a hospital-based study from South India. Epilepsia. 1998 Jan;39(1):48–54. - PubMed
-
- Ng M, Devinsky O. Vagus nerve stimulation for refractory idiopathic generalised epilepsy. Seizure. 2004 Apr;13(3):176–8. - PubMed
Publication types
MeSH terms
Substances
Grants and funding
LinkOut - more resources
Full Text Sources
Medical
Research Materials
