Comparative Study
. 2010 Oct 15;53(1):103-18.
doi: 10.1016/j.neuroimage.2010.05.051. Epub 2010 May 23.

Comparison of multivariate classifiers and response normalizations for pattern-information fMRI

Affiliations
Comparative Study

Comparison of multivariate classifiers and response normalizations for pattern-information fMRI

Masaya Misaki et al. Neuroimage. .

Abstract

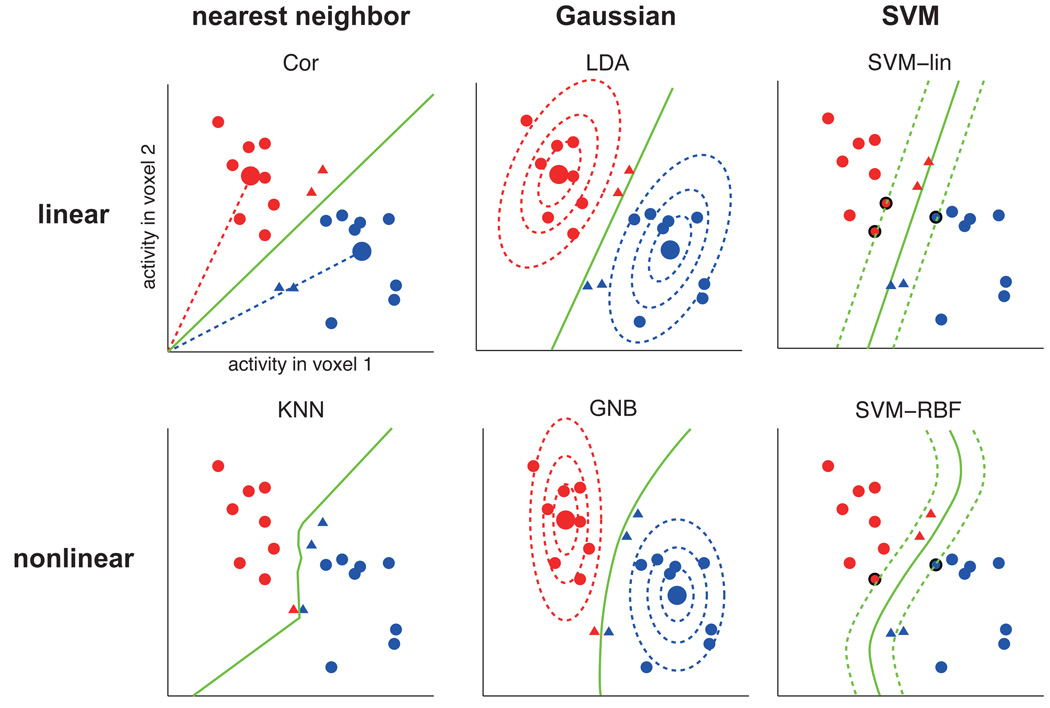
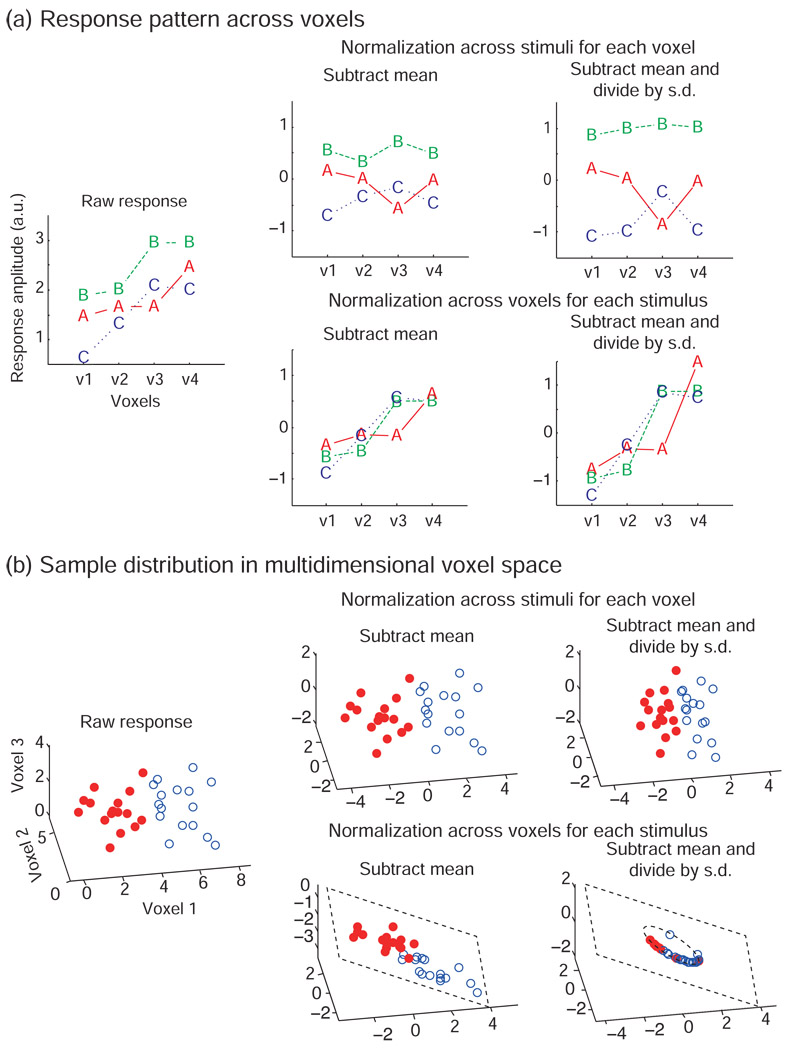
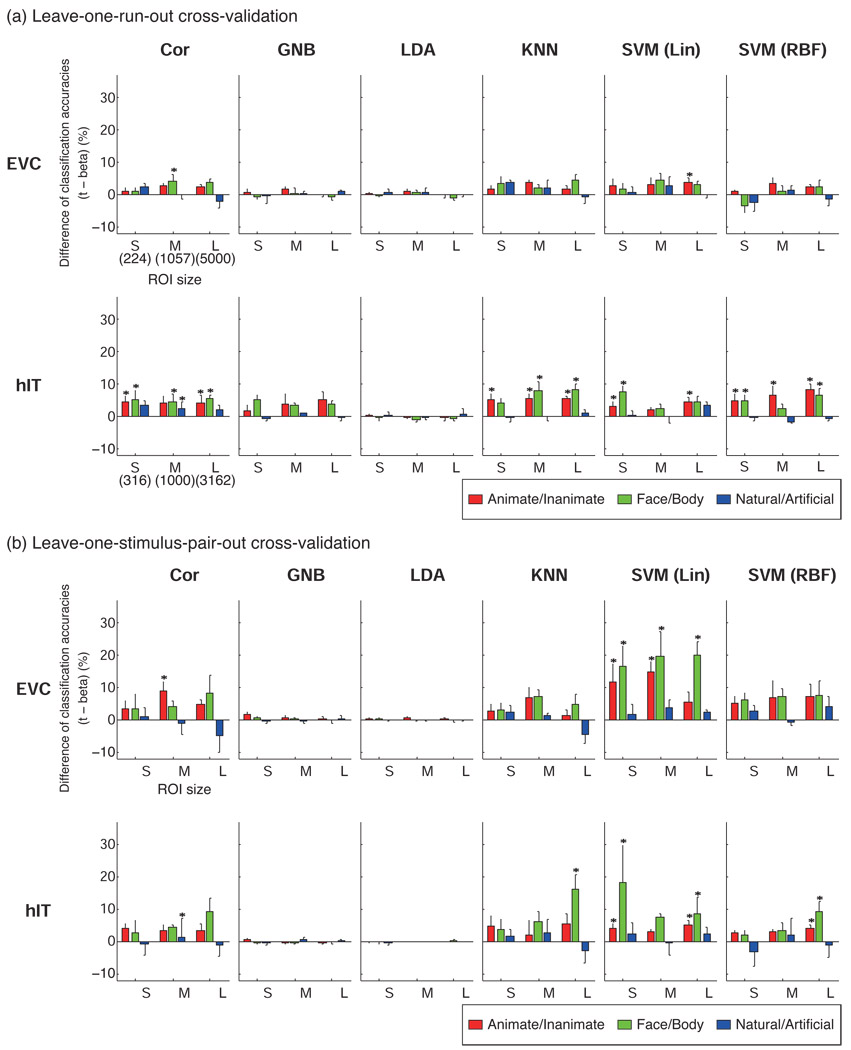
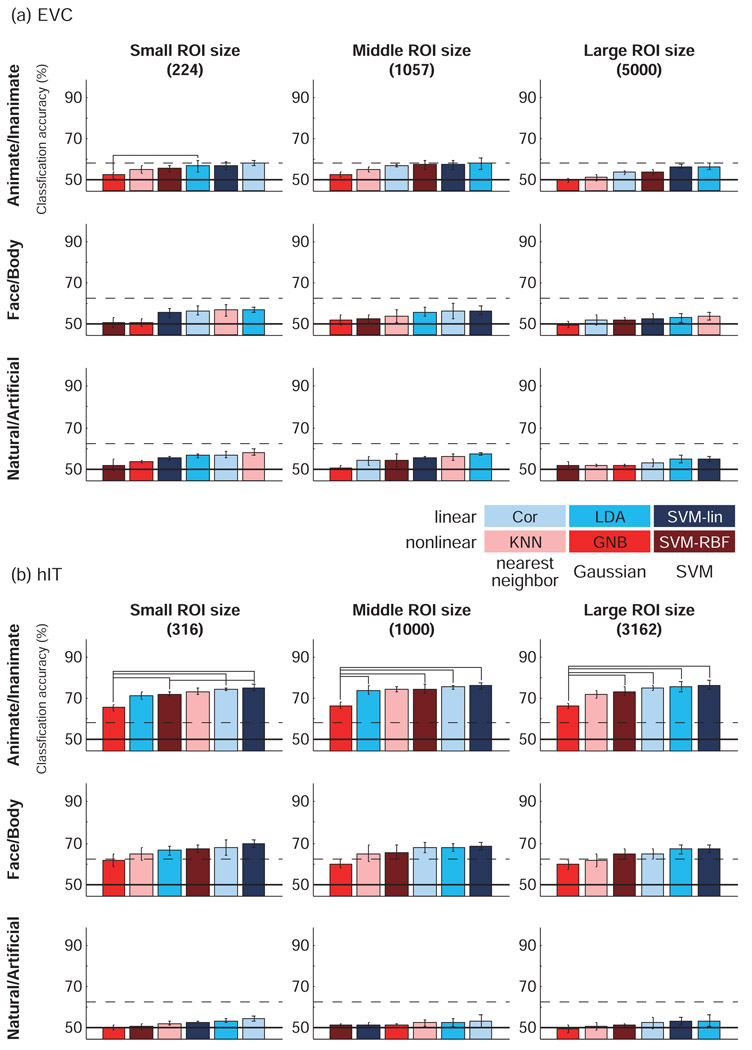
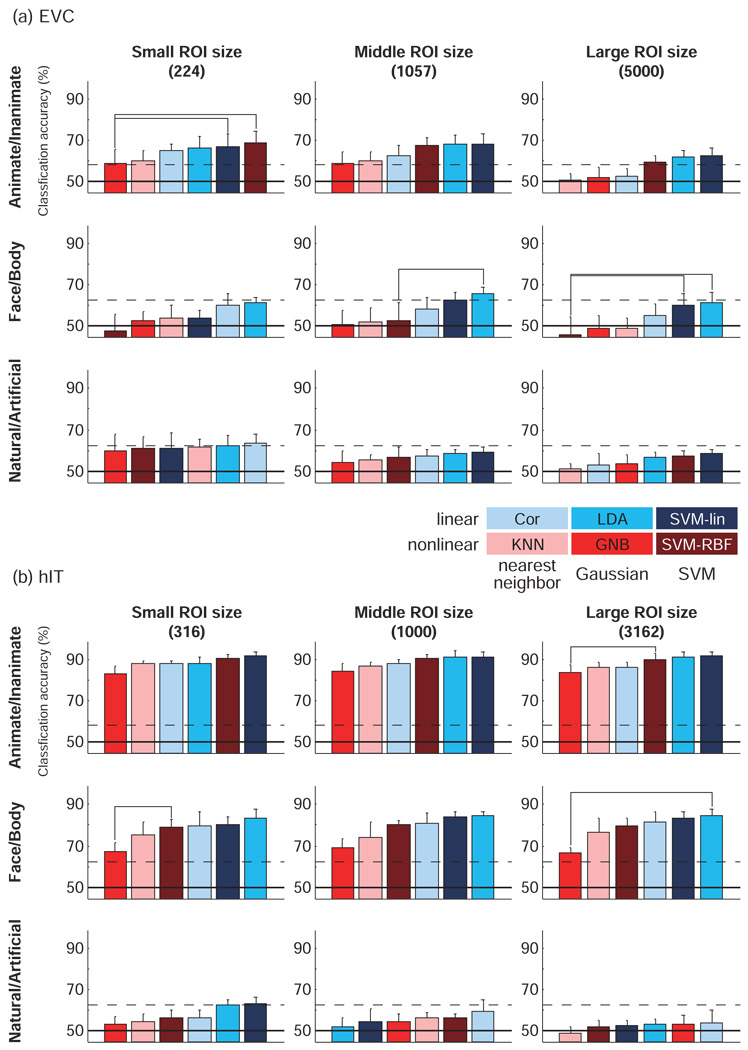
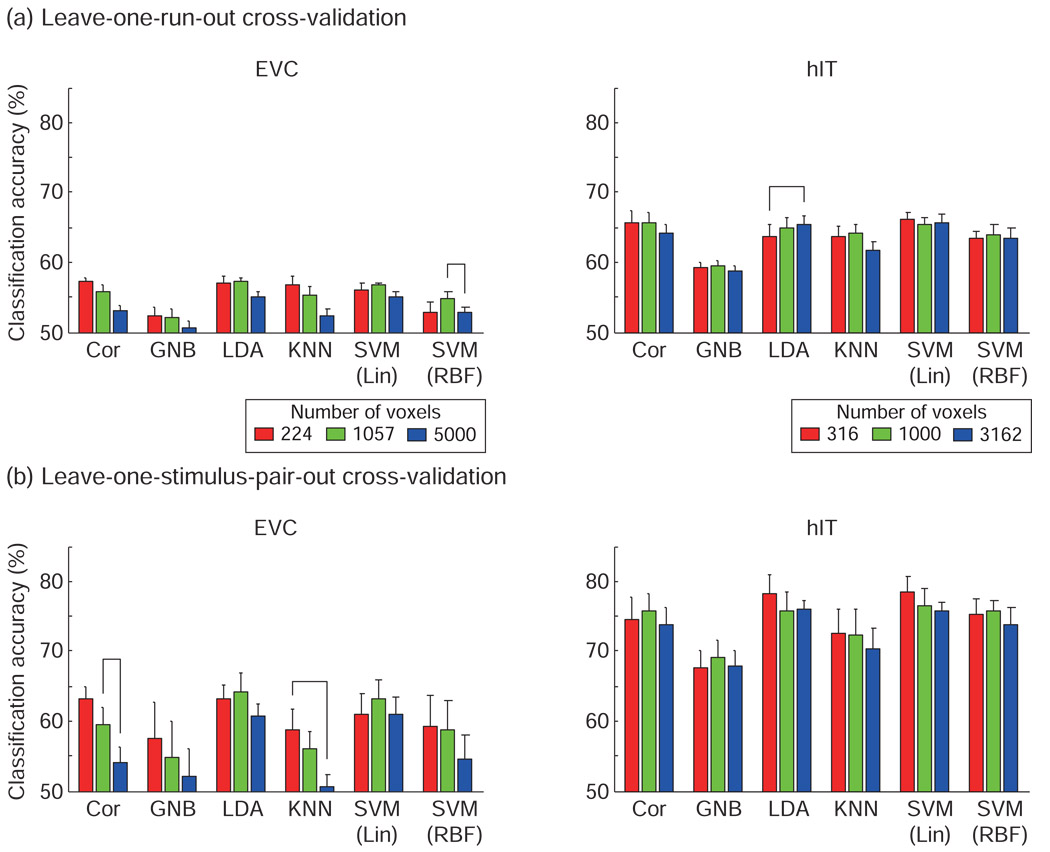
A popular method for investigating whether stimulus information is present in fMRI response patterns is to attempt to "decode" the stimuli from the response patterns with a multivariate classifier. The sensitivity for detecting the information depends on the particular classifier used. However, little is known about the relative performance of different classifiers on fMRI data. Here we compared six multivariate classifiers and investigated how the response-amplitude estimate used (beta- or t-value) and different pattern normalizations affect classification performance. The compared classifiers were a pattern-correlation classifier, a k-nearest-neighbors classifier, Fisher's linear discriminant, Gaussian naïve Bayes, and linear and nonlinear (radial-basis-function kernel) support vector machines. We compared these classifiers' accuracy at decoding the category of visual objects from response patterns in human early visual and inferior temporal cortex acquired in an event-related design with BOLD fMRI at 3T using SENSE and isotropic voxels of about 2-mm width. Overall, Fisher's linear discriminant (with an optimal-shrinkage covariance estimator) and the linear support vector machine performed best. The pattern-correlation classifier often performed similarly as those two classifiers. The nonlinear classifiers never performed better and sometimes significantly worse than the linear classifiers, suggesting overfitting. Defining response patterns by t-values (or in error-standard-deviation units) rather than by beta estimates (in % signal change) to define the patterns appeared advantageous. Cross-validation by a leave-one-stimulus-pair-out method gave higher accuracies than a leave-one-run-out method, suggesting that generalization to independent runs (which more safely ensures independence of the test set) is more challenging than generalization to novel stimuli within the same category. Independent selection of fewer more visually responsive voxels tended to yield better decoding performance for all classifiers. Normalizing mean and standard deviation of the response patterns either across stimuli or across voxels had no significant effect on decoding performance. Overall our results suggest that linear decoders based on t-value patterns may perform best in the present scenario of visual object representations measured for about 60min per subject with 3T fMRI.


Figures

Figure 1
Figure 1. Different pattern classifiers use different decision boundaries
Hypothetical example of classification by different classifiers. Each classifier determines a different decision boundary on the basis of a set of training patterns (red and blue circles). As a result, test patterns in the ambiguous territory between the two clusters (red and blue triangles) will be classified differently by the different classifiers. The color of the triangles indicates which class it is classified as. The large circles, where present, are the class centroids (i.e. class-average patterns). The dotted ellipsoids (for GNB and LDA) are iso-probability-density contours of the fitted Gaussian distributions. For the SVMs, the dotted lines represent the margin around the decision boundary and the bold-edged circles are the support vectors defining the boundary.
Figure 2
Figure 2. Pattern normalization can be performed across voxels or across stimuli
This figure illustrates how the different normalizations change response patterns. The plotted data are hypothetical. (a) Each panel shows response amplitudes of four voxels (v1, v2, v3, v4) for each of three stimuli (A, B, and C). The left panel shows the raw response. The upper row shows the normalization across stimuli for each voxel. This normalization changes the response pattern across voxels but preserves relative response differences between stimuli in each voxel. The lower row shows the normalization across voxels in each stimulus. This normalization preserves the shape of the response pattern across voxels for each stimulus but changes relative response differences between stimuli in each voxel. (b) Each panel shows the distributions of the response patterns for two classes (solid red circles and open blue circles) in the voxels’ response space. The left panel shows the raw response-pattern distributions. The upper row shows the normalization across stimuli for each voxel. This normalization shifts and scales the distributions in the response space. Note the shift of the origin of the axes. The lower row shows the normalization across voxels for each stimulus. This normalization projects the points onto a hyperplane by subtracting the mean, and then onto a hypersphere within that hyperplane by dividing by the standard deviation. Note that removing 2 dimensions in this 3-dimensional cartoon example leaves only one dimension (i.e. the circle in the plane) for the patterns to vary along. For high-dimensional response patterns (d dimensions), however, the hypersphere will have similar dimensionality (d-2) as the original space, and the loss of information may be small.
Figure 3
Figure 3. Defining the response patterns by t-values instead of beta estimates yielded better or equal decoding accuracy
The bars show the difference of classification accuracy between patterns defined by t-values and patterns defined by beta estimates. Positive values (upward bars) mean that t-values gave better classification accuracy than beta estimates. Error bars show the standard error of the mean across subjects. The statistical analysis (paired t test across stimuli) was performed for each subject separately and an asterisk indicates a significant difference (p < 0.05) in at least two of four subjects. S, M, and L indicate the small, middle and large ROI size, respectively. The numbers of voxels in S, M, L were 224, 1057, 5000 for EVC, and 316, 1000, 3162, for hIT. Significant differences were only seen in favor of t-values. LDA and GNB were not significantly affected by the difference of response estimates because they model and thus correct for the variance along each response dimension (see Discussion for details).
Figure 4
Figure 4. Linear classifiers performed best and not significantly differently (leave-one-run-out cross-validation)
Classification accuracies estimated with leave-one-run-out cross-validation for each classification method for (a) EVC ROI and (b) hIT ROI. The voxels in ROI were selected by visual responsiveness assessed using the average response for the 96 stimuli (t-value) in a separate experiment. Response patterns were defined by t-values. Accuracies are averages across subjects and stimuli. Error bars show the standard error of the mean across subjects. Classifiers were ordered by their mean classification accuracies. Chance-level accuracy was 50% (solid line). The upper dashed line indicates the significance threshold for better-than-chance decoding (indicating the presence of pattern information). For a single-subject accuracy exceeding the significance line, p < 0.05 (not corrected for multiple tests) for a binomial test with 96 trials for Animate/Inanimate, and 48 for Face/Body and Natural/Artificial (H0: chance-level decoding). The horizontal connection lines above the bars indicate significant differences between classifiers (p < 0.05 with Bonferroni correction for the 15 pairwise comparisons of the 6 classifiers) seen in at least two of four subjects (paired t test across stimuli). With this procedure, a horizontal connection indicates a significant difference of decoding accuracy between two classifiers at p<0.036, corrected for the multiple tests across pairs of classifiers, across subjects, and across all scenarios (region, ROI size, category dichotomy, and cross-validation method) of Figs. 4 and 5 combined (see Results for details). LDA and SVM-lin tended to perform best and not significantly differently.
Figure 5
Figure 5. Linear classifiers performed best and not significantly differently (leave-one-stimulus-pair-out cross-validation)
Classification accuracies estimated with leave-one-stimulus-pair-out cross-validation for each classification method for (a) EVC ROI and (b) hIT ROI. All conventions as in Fig. 4.
Figure 6
Figure 6. Accuracy was not strongly dependent on ROI size for most classifiers, but dropped for large ROIs in Cor and KNN
This figure compares decoding accuracies across ROI sizes for each classifier. Classification accuracies were rarely significantly affected by changes of ROI size (horizontal connections between bars). The accuracy of Cor and KNN decreased for larger early visual ROIs, suggesting overfitting. Results are presented separately for each brain region and cross-validation method. Accuracies are averaged across the three category dichotomies (animate/inanimate, face/body, natural/artificial) and across subjects. Error bars show the standard error of the mean across subjects. The horizontal connection lines above the bars indicate significant differences between classifiers (p < 0.05 with Bonferroni correction) seen in at least two of four subjects (paired t test across stimuli).
Figure 7
Figure 7. Normalization of response patterns across stimuli or across voxels had no significant effect on classification accuracy
Mean classification accuracies for raw patterns of t-values and for normalized patterns. Patterns were initially defined by t-values (red bars). Error bars show the standard error of the mean across subjects. The left-column panels show across-stimuli normalizations: the patterns were normalized by subtracting the mean across stimuli (green bars) and then additionally dividing by the standard deviation across stimuli for each voxel (blue bars). The right-column panels show across-voxels normalizations: the data were normalized by subtracting the mean across voxels (green bars) and then additionally dividing by the standard deviation across voxels for each stimulus (blue bars). Results are shown separately for leave-one-run-out cross-validation (a) and leave-one-stimulus-pair-out cross-validation (b), but averaged across ROIs, ROI sizes, category dichotomies, and subjects. The statistical analysis was performed separately for each ROI, ROI size, category dichotomy, and subject. We found no significant effects of the four different pattern normalizations (paired t tests across stimuli, p < 0.05, Bonferroni-corrected, in at least two of four subjects).

Similar articles

Cited by

References

    1. Bishop CM. Pattern Recognition and Machine Learning. New York: Springer; 2007.
    1. Björnsdotter Åberg M, Löken L, Wessberg J. An Evolutionary Approach to Multivariate Feature Selection for FMRI Pattern Analysis. BIOSIGNALS. 2008;(2):302–307. 2008.
    1. Boynton GM, Engel SA, Glover GH, Heeger DJ. Linear systems analysis of functional magnetic resonance imaging in human V1. J Neurosci. 1996;16:4207–4221. - PMC - PubMed
    1. Chang C-C, Lin C-J. LIBSVM: a library for support vector machines, Software. 2001. available at http://www.csie.ntu.edu.tw~cjlin/libsvm.
    1. Cox DD, Savoy RL. Functional magnetic resonance imaging (fMRI) "brain reading": detecting and classifying distributed patterns of fMRI activity in human visual cortex. NeuroImage. 2003;19:261–270. - PubMed

Publication types