. 2010:472:153-78.
doi: 10.1016/S0076-6879(10)72011-5.

Analysis of complex single-molecule FRET time trajectories

Affiliations

Analysis of complex single-molecule FRET time trajectories

Mario Blanco et al. Methods Enzymol. 2010.

Abstract

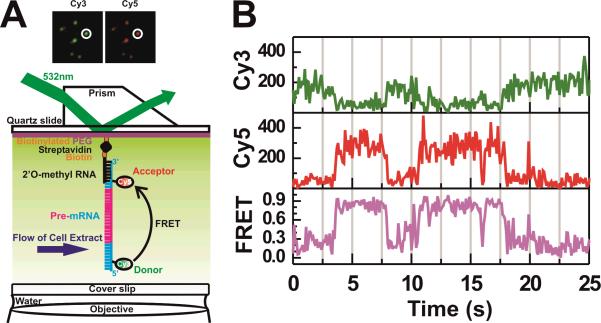
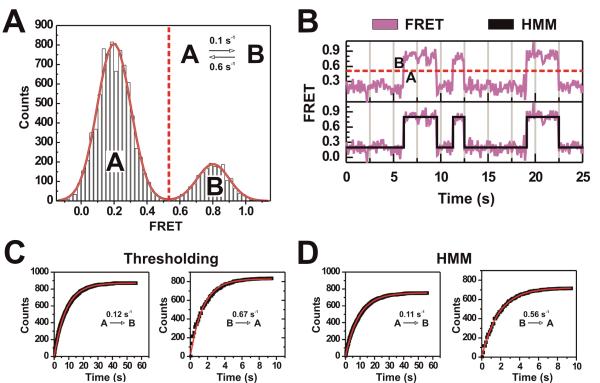
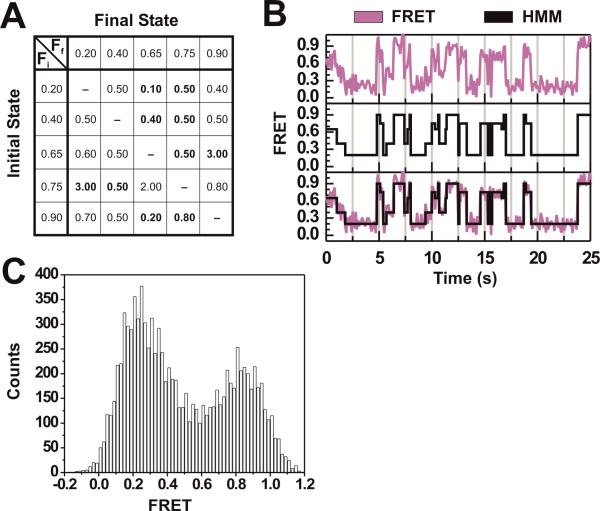
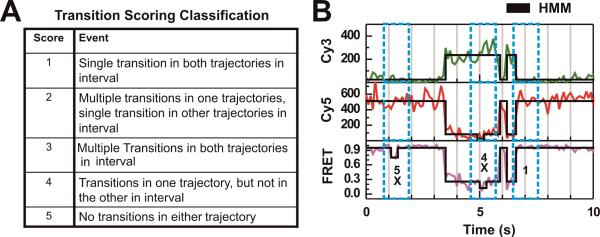
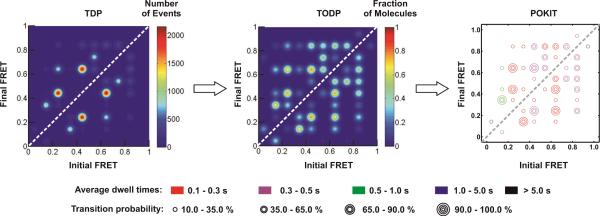
Single-molecule methods have given researchers the ability to investigate the structural dynamics of biomolecules at unprecedented resolution and sensitivity. One of the preferred methods of studying single biomolecules is single-molecule fluorescence resonance energy transfer (smFRET). The popularity of smFRET stems from its ability to report on dynamic, either intra- or intermolecular interactions in real-time. For example, smFRET has been successfully used to characterize the role of dynamics in functional RNAs and their protein complexes, including ribozymes, the ribosome, and more recently the spliceosome. Being able to reliably extract quantitative kinetic and conformational parameters from smFRET experiments is crucial for the interpretation of their results. The need for efficient, unbiased analysis routines becomes more evident as the systems studied become more complex. In this chapter, we focus on the practical utility of statistical algorithms, particularly hidden Markov models, to aid in the objective quantification of complex smFRET trajectories with three or more discrete states, and to extract kinetic information from the trajectories. Additionally, we present a method for systematically eliminating transitions associated with uncorrelated fluorophore behavior that may occur due to dye anisotropy and quenching effects. We also highlight the importance of data condensation through the use of various transition density plots to fully understand the underlying conformational dynamics and kinetic behavior of the biological macromolecule of interest under varying conditions. Finally, the application of these techniques to studies of pre-mRNA conformational changes during eukaryotic splicing is discussed.


Figures

Figure 1
Figure 1. Capturing the conformational dynamics of single pre-mRNA molecules through smFRET in real-time
(A) A pre-mRNA molecule is immobilized through a 2'-O-methylated capture oligonucleotide, and is bound to a PEG passivated quartz slide through a biotin-streptavidin interaction. The inset depicts a portion of a field of view captured by the I-CCD camera, and how the donor (Cy3) and acceptor (Cy5) fluorophores can be captured simultaneously. Peak finder algorithms are used to automatically find and match corresponding fluorophores from single molecules (white circles). (B) Exemplary fluorescence intensity and FRET changes of a single molecule.
Figure 2
Figure 2. Histogram distribution analysis, thresholding, and hidden Markov modeling are well suited for simple trajectories
(A) Simulated FRET probability distribution created by simulating 10 s at 100 ms repetition rate (1,000 data points) each of 100 molecules based on a two-state model (inset). The distribution was fit using two Gaussians whose sum models the distribution well (red outline). The centers of the Gaussians as determined by the fitting routine are situated at 0.203 and 0.802. (B) A sample trajectory of the simulated two-state system with discrete FRET states determined through either thresholiding (top) or hidden Markov modeling (HMM) (bottom). (C) Dwell time analysis of the simulated two-state system after determining the dwell times using the thresholding method or HMM. Measured dwell times were binned and plotted as a cumulative distribution and then fit with single-exponential functions using Microcal Origin.
Figure 3
Figure 3. Complex trajectories are not amenable to thresholding and distribution analysis, but require hidden Markov modeling
(A) Parameters used for simulating a five-state system. FRET states and their transition rate constants are depicted as a transition matrix with the slowest and fastest rate constants (all in s−1) in bold. Fi = initial FRET state; Ff = final FRET state. (B) Raw FRET trajectory of one exemplary molecule simulated with the parameters in Fig. 3A (top). The idealized trajectory as determined by HMM executed in QuB (middle) and both trajectories overlaid (bottom). (C) FRET probability distribution of the simulated five-state system. This histogram shows that even in simulated data the five underlying states are obscured by noise, rendering distribution analysis less informative as in simple two-state systems.
Figure 4
Figure 4. Local correlation analysis utilizing HMM algorithms and transition scoring
(A) Transition quality scoring used to exclude artificial FRET transitions caused by unilateral changes in one fluorophore. In our studies we are interested in only transitions with scores 1–3, since these transitions exhibit anti-correlated changes in the fluorescence intensity of both fluorophores simultaneously, as indicated. The time-window used to search for transitions in the donor and acceptor trajectories is set by examining the FRET trajectory. The size of the time window we chose to relate to the dwell time immediately before the FRET transition being scored. (B) Experimental trajectory and the scores of highlighted transitions after idealizing the donor signal, acceptor signal, and FRET using hidden Markov modeling (black lines). Transitions marked with an x are not characterized by donor-acceptor anti-correlation and not considered in any further analysis.
Figure 5
Figure 5. Data visualization for complex trajectories, including TDP and POKIT plot analysis
A side-by-side comparison of the same data set using three representations. Traditional TDPs are scaled by the number of times a transition is observed over all molecules, regardless of whether in only a small sub-population of molecules with rapid transitions or commonly in all molecules. TODP and POKIT plots are scaled by the fraction of all molecules within a population that exhibits a particular transition. POKIT plots additionally provide kinetic information encoded in the color of the concentric circles.

Similar articles

Cited by

References

    1. Abelson J, Blanco M, Ditzler MA, Fuller F, Aravamudhan P, Wood M, Villa T, Ryan DE, Pleiss JA, Maeder C, Guthrie C, Walter NG. Conformational dynamics of single pre-mRNA molecules during in vitro splicing. Nat. Struct. Mol. Biol. 2010 in press. - PMC - PubMed
    1. Aitken CE, Marshall RA, Puglisi JD. An oxygen scavenging system for improvement of dye stability in single-molecule fluorescence experiments. Biophys. J. 2008;94:1826–1835. - PMC - PubMed
    1. Bokinsky G, Rueda D, Misra VK, Rhodes MM, Gordus A, Babcock HP, Walter NG, Zhuang X. Single-molecule transition-state analysis of RNA folding. Proc. Natl. Acad. Sci. USA. 2003;100:9302–9307. - PMC - PubMed
    1. Bronson JE, Fei J, Hofman JM, Gonzalez RL, Jr., Wiggins CH. Learning rates and states from biophysical time series: a Bayesian approach to model selection and single-molecule FRET data. Biophys. J. 2009;97:3196–3205. - PMC - PubMed
    1. Ditzler MA, Rueda D, Mo J, Hakansson K, Walter NG. A rugged free energy landscape separates multiple functional RNA folds throughout denaturation. Nucleic Acids Res. 2008;36:7088–7099. - PMC - PubMed

LinkOut - more resources