

Kinetic analysis of the effects of H+ or Ni2+ on Kv1.5 current shows that both ions enhance slow inactivation and induce resting inactivation
- PMID: 20581043
- PMCID: PMC2956942
- DOI: 10.1113/jphysiol.2010.191544
Kinetic analysis of the effects of H+ or Ni2+ on Kv1.5 current shows that both ions enhance slow inactivation and induce resting inactivation
Abstract
External H+ and Ni2+ ions inhibit Kv1.5 channels by increasing current decay during a depolarizing pulse and reducing the maximal conductance. Although the former may be attributed to an enhancement of slow inactivation occurring from the open state, the latter cannot. Instead, we propose that the loss of conductance is due to the induction, by H+ or Ni2+, of a resting inactivation process. To assess whether the two inactivation processes are mechanistically related, we examined the time courses for the onset of and recovery from H+- or Ni2+-enhanced slow inactivation and resting inactivation. Compared to the time course of H+- or Ni2+-enhanced slow inactivation at +50 mV, the onset of resting inactivation induced at 80 mV with either ion involves a relatively slower process. Recovery from slow inactivation under control conditions was bi-exponential, indicative of at least two inactivated states. Recovery following H+- or Ni2+-enhanced slow inactivation or resting inactivation had time constants similar to those for recovery from control slow inactivation, although H+ and Ni2+ biased inactivation towards states from which recovery was fast and slow, respectively. The shared time constants suggest that the H+- and Ni2+-enhanced slow inactivated and induced resting inactivated states are similar to those visited during control slow inactivation at pH 7.4. We conclude that in Kv1.5 H+ and Ni2+ differentially enhance a slow inactivation process that involves at least two inactivated states and that resting inactivation is probably a close variant of slow inactivation.
Figures
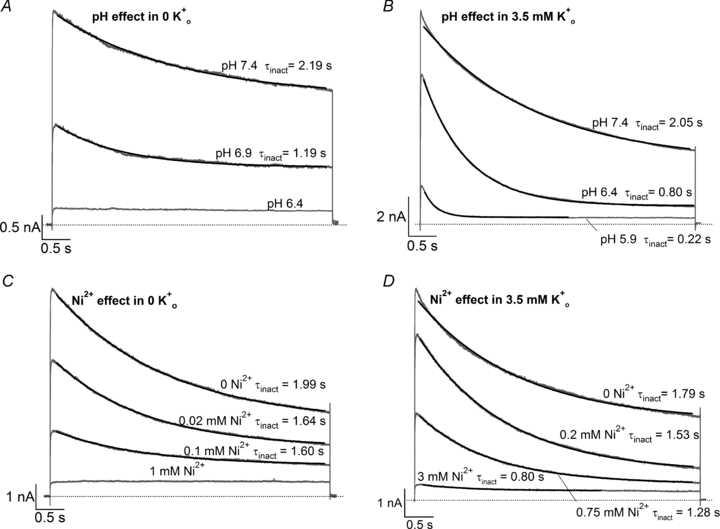
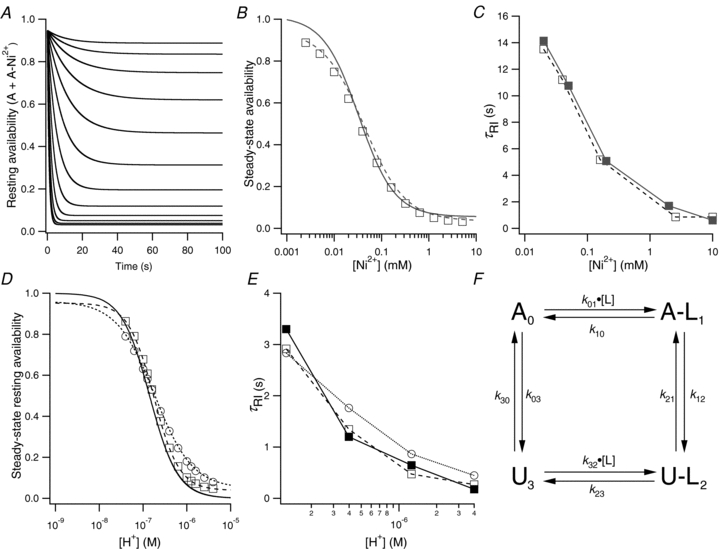
 , low pH decreases both peak Kv1.5 current and τinact. Pooled data from 4 cells gave a p the pKa for the decrease in peak current was 6.2, with a Hill coefficient of 1.8 (n = 4 cells). C, Ni2+ also causes a concentration-dependent decrease in peak current but this is associated with relatively smaller decreases of the test current decay rate. From 4 cells, the fit of the [Ni2+] dependence of the mean normalized peak current amplitude to the Hill equation gave Kd and Hill coefficient values of 0.034 m the Kd for the [Ni2+]-dependent decrease of peak current amplitude was 0.52 m
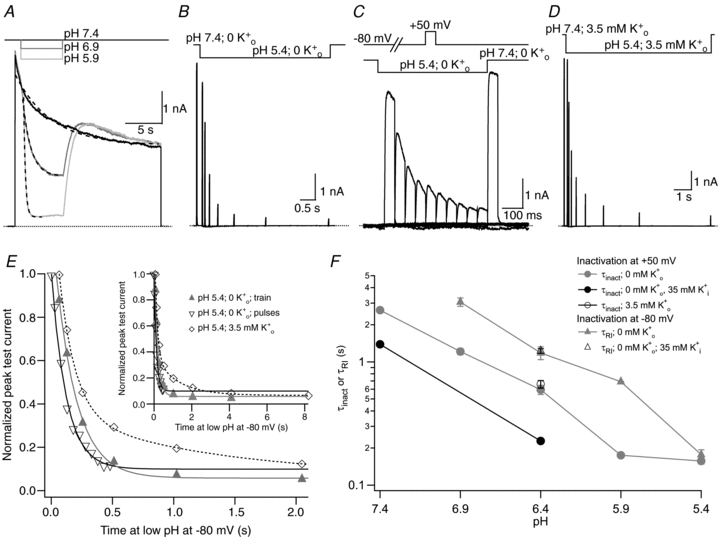 . After a 20 ms control pulse to +50 mV at pH 7.4, the external pH was decreased and a pulse train with increasing interpulse intervals was applied during a single sweep. C, resting inactivation was also assessed with multiple (superimposed) sweeps. In each sweep a single test pulse was applied at a known interval after the switch to pH 5.4; the interval was increased for each successive sweep. The final, control, trace was obtained without prior exposure to low pH. D, the onset of resting inactivation induced by pH 5.4 in 3.5 m was measured as described for B. E, test currents from (B–D) were normalized to their respective controls and plotted against the cumulative time spent at −80 mV at pH 5.4. Inset, the same plot on a longer time scale shows the steady-state level. The continuous and dashed lines represent mono- and bi-exponential fits of the data, respectively; τRI at pH 5.4 in 0 was 171 ms and 122 ms measured with a train and single pulses, respectively. In 3.5 m at pH 5.4, τRI,fast and τRI,slow were 131 ms and 1.24 s, respectively. F, time constants for low pH enhanced slow inactivation and resting inactivation derived from experiments such as those in A and B are plotted against pH. All data points represent the mean ±
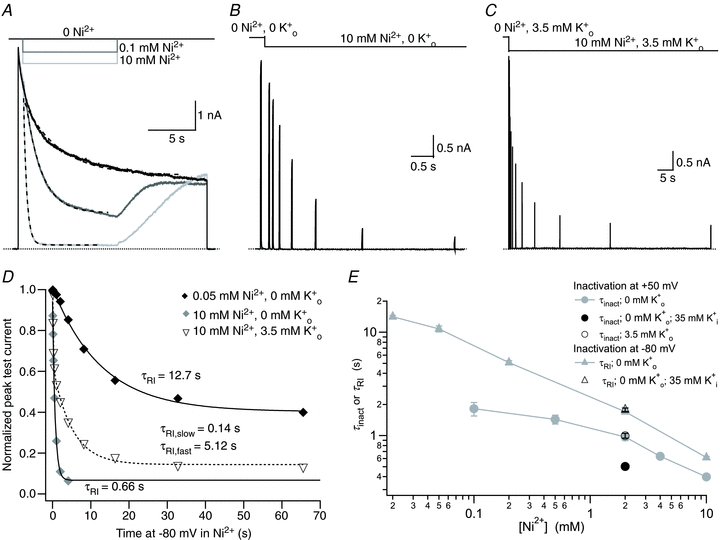 . After a 20 ms control pulse from −80 mV to +50 mV in 0 m. D, test currents from (B and C) were normalized to their respective controls and plotted against the cumulative time spent at −80 mV in Ni2+. For comparison, results from an experiment using 0.05 m
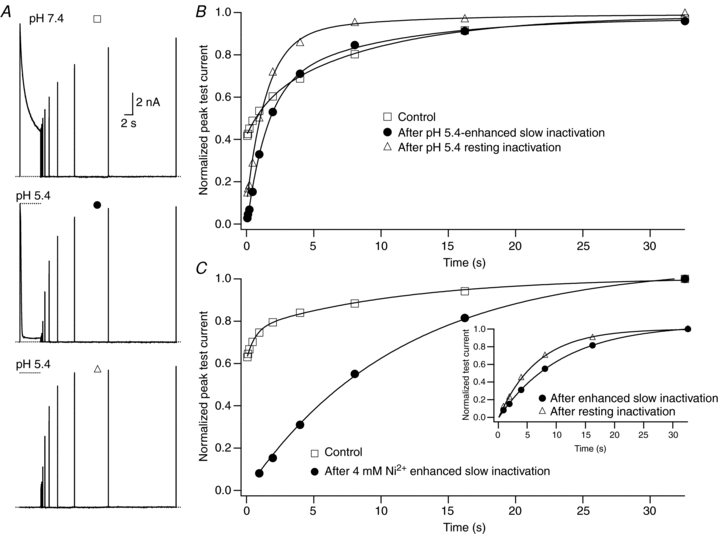 from the same cell showing: recovery at pH 7.4 from control slow inactivation (□); recovery at pH 7.4 from slow inactivation enhanced by pH 5.4 (•); and recovery at pH 7.4 from resting inactivation induced by pH 5.4 (▵). The voltage clamp protocol consisted of a 5 s step to +50 mV, except for the resting inactivation trace, followed by a train of 20 ms test pulses to +50 mV. The dotted horizontal lines indicate the duration of the exposure to pH 5.4 solution. B, peak test currents from A, normalized with respect to the peak control current, are plotted against the cumulative recovery time spent at the −80 mV holding potential. The continuous lines represent the simultaneous fit to a double exponential function of the time course of recovery from control slow inactivation (□), H+-enhanced slow inactivation (•) and resting inactivation (▵). The resulting values for τrec,f and τrec,s were 1.48 s and 9.14 s, respectively. C, normalized peak recovery currents measured with the same protocol as in (A), but with 4 m
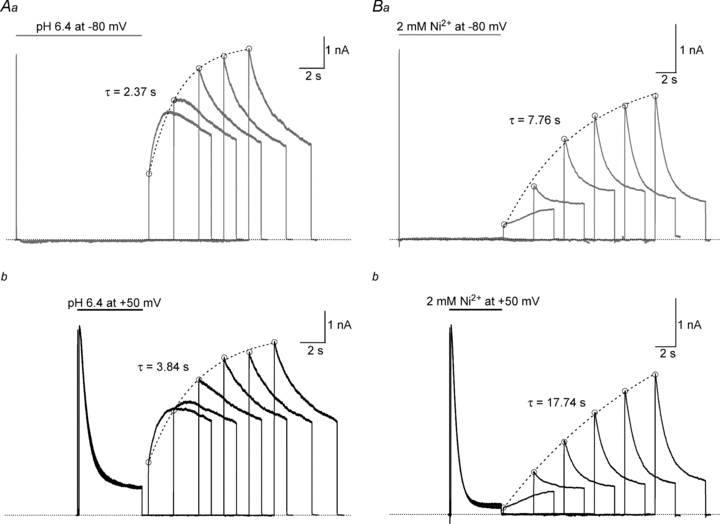 solution, resting inactivation at −80 mV was induced by a 10 s application of either pH 6.4 (Aa) or 2 m
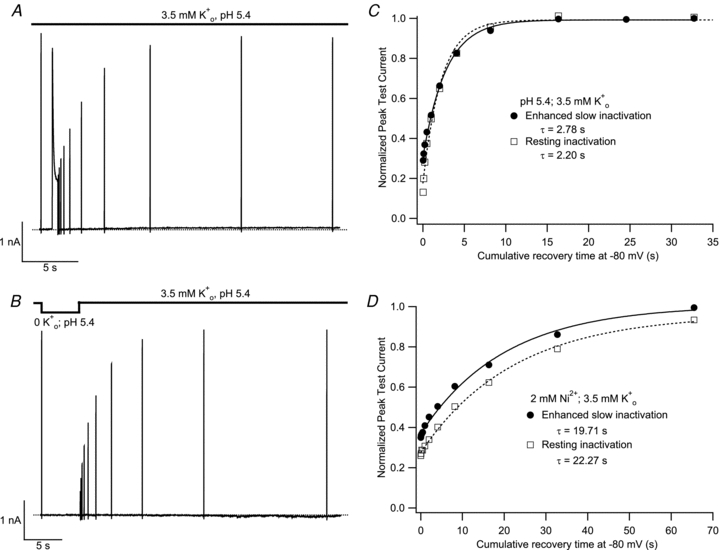 was monitored, in A, after a 500 ms pulse to +50 mV or, in B, after channel availability was decreased by a 5 s exposure to K+-free, pH 5.4 solution. Recovery was monitored using 20 ms test pulses applied at increasing intervals within the same sweep. C, peak test current amplitudes from A and B were normalized with respect to the initial control pulse and plotted against the cumulative recovery time spent at −80 mV. Both data sets were well fitted by a mono-exponential function and had similar time constants. Data shown are from the same cell and are representative of 3 experiments. D, data from another cell (representative of 4 such experiments), where the experiment protocol was analogous to that of panels A and B, and was performed at pH 7.4 with 2 m
Similar articles
-
ShakerIR and Kv1.5 mutant channels with enhanced slow inactivation also exhibit K⁺ o-dependent resting inactivation.Pflugers Arch. 2013 Nov;465(11):1545-55. doi: 10.1007/s00424-013-1297-x. Epub 2013 May 26. Pflugers Arch. 2013. PMID: 23708835
-
NH2-terminal inactivation peptide binding to C-type-inactivated Kv channels.J Gen Physiol. 2004 May;123(5):505-20. doi: 10.1085/jgp.200308956. Epub 2004 Apr 12. J Gen Physiol. 2004. PMID: 15078918 Free PMC article.
-
A high-Na(+) conduction state during recovery from inactivation in the K(+) channel Kv1.5.Biophys J. 2000 Nov;79(5):2416-33. doi: 10.1016/S0006-3495(00)76486-1. Biophys J. 2000. PMID: 11053120 Free PMC article.
-
Synergistic inhibition of the maximum conductance of Kv1.5 channels by extracellular K+ reduction and acidification.Cell Biochem Biophys. 2005;43(2):231-42. doi: 10.1385/CBB:43:2:231. Cell Biochem Biophys. 2005. PMID: 16049348 Review.
-
Emerging issues of connexin channels: biophysics fills the gap.Q Rev Biophys. 2001 Aug;34(3):325-472. doi: 10.1017/s0033583501003705. Q Rev Biophys. 2001. PMID: 11838236 Review.
Cited by
-
Genetic ablation of CaV3.2 channels enhances the arterial myogenic response by modulating the RyR-BKCa axis.Arterioscler Thromb Vasc Biol. 2015 Aug;35(8):1843-51. doi: 10.1161/ATVBAHA.115.305736. Epub 2015 Jun 11. Arterioscler Thromb Vasc Biol. 2015. PMID: 26069238 Free PMC article.
-
Regulation of human cardiac Kv1.5 channels by extracellular acidification.Pflugers Arch. 2016 Nov;468(11-12):1885-1894. doi: 10.1007/s00424-016-1890-x. Epub 2016 Oct 28. Pflugers Arch. 2016. PMID: 27796577
-
Molecular determinants of U-type inactivation in Kv2.1 channels.Biophys J. 2011 Aug 3;101(3):651-61. doi: 10.1016/j.bpj.2011.06.025. Biophys J. 2011. PMID: 21806933 Free PMC article.
-
ShakerIR and Kv1.5 mutant channels with enhanced slow inactivation also exhibit K⁺ o-dependent resting inactivation.Pflugers Arch. 2013 Nov;465(11):1545-55. doi: 10.1007/s00424-013-1297-x. Epub 2013 May 26. Pflugers Arch. 2013. PMID: 23708835
-
Gating and Regulation of KCNQ1 and KCNQ1 + KCNE1 Channel Complexes.Front Physiol. 2020 Jun 4;11:504. doi: 10.3389/fphys.2020.00504. eCollection 2020. Front Physiol. 2020. PMID: 32581825 Free PMC article. Review.
References
-
- Basso C, Labarca P, Stefani E, Alvarez O, Latorre R. Pore accessibility during C-type inactivation in Shaker K+ channels. FEBS Lett. 1998;429:375–380. - PubMed
-
- Baukrowitz T, Yellen G. Modulation of K+ current by frequency and external [K+]: a tale of two inactivation mechanisms. Neuron. 1995;15:951–960. - PubMed
-
- Claydon TW, Kehl SJ, Fedida D. Closed-state inactivation induced in Kv1 channels by extracellular acidification. Channels (Austin) 2008;2:139–142. - PubMed
Publication types
MeSH terms
Substances
Grants and funding
LinkOut - more resources
Full Text Sources
Medical