. 2010 Sep;299(3):H643-55.
doi: 10.1152/ajpheart.00074.2010. Epub 2010 Jun 25.

Electrophysiological studies of transgenic long QT type 1 and type 2 rabbits reveal genotype-specific differences in ventricular refractoriness and His conduction

Affiliations

Electrophysiological studies of transgenic long QT type 1 and type 2 rabbits reveal genotype-specific differences in ventricular refractoriness and His conduction

Katja E Odening et al. Am J Physiol Heart Circ Physiol. 2010 Sep.

Abstract

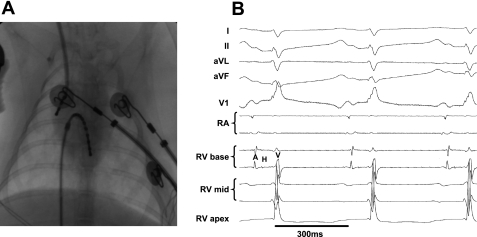
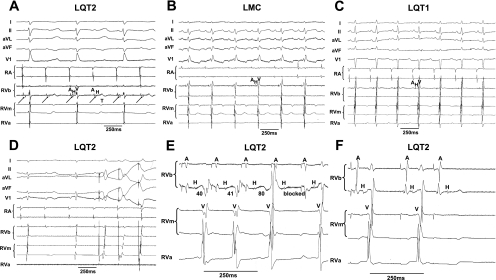
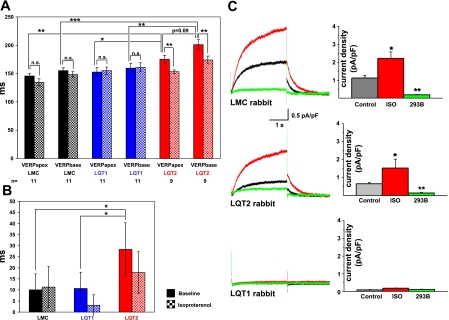
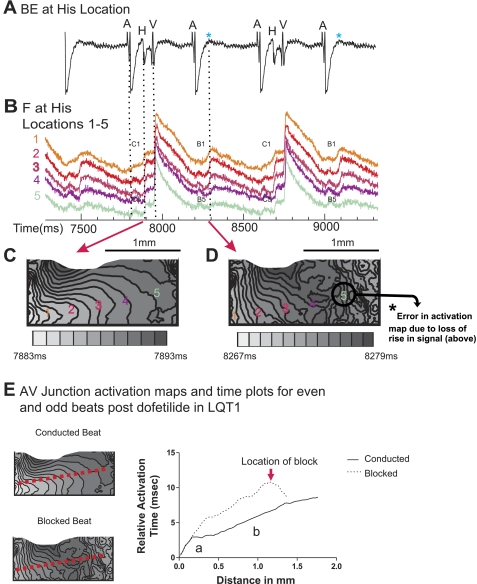
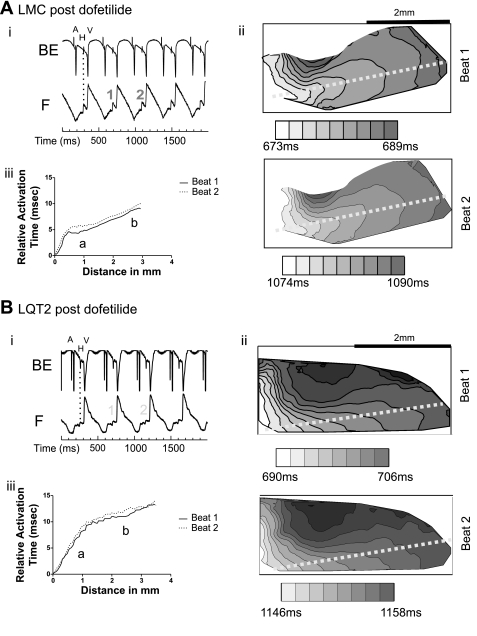
We have generated transgenic rabbits lacking cardiac slow delayed-rectifier K(+) current [I(Ks); long QT syndrome type 1 (LQT1)] or rapidly activating delayed-rectifier K(+) current [I(Kr); long QT syndrome type 2 (LQT2)]. Rabbits with either genotype have prolonged action potential duration and QT intervals; however, only LQT2 rabbits develop atrioventricular (AV) blocks and polymorphic ventricular tachycardia. We therefore sought to characterize the genotype-specific differences in AV conduction and ventricular refractoriness in LQT1 and LQT2 rabbits. We carried out in vivo electrophysiological studies in LQT1, LQT2, and littermate control (LMC) rabbits at baseline, during isoproterenol infusion, and after a bolus of dofetilide and ex vivo optical mapping studies of the AV node/His-region at baseline and during dofetilide perfusion. Under isoflurane anesthesia, LQT2 rabbits developed infra-His blocks, decremental His conduction, and prolongation of the Wenckebach cycle length. In LQT1 rabbits, dofetilide altered the His morphology and slowed His conduction, resulting in intra-His block, and additionally prolonged the ventricular refractoriness, leading to pseudo-AV block. The ventricular effective refractory period (VERP) in right ventricular apex and base was significantly longer in LQT2 than LQT1 (P < 0.05) or LMC (P < 0.01), with a greater VERP dispersion in LQT2 than LQT1 rabbits. Isoproterenol reduced the VERP dispersion in LQT2 rabbits by shortening the VERP in the base more than in the apex but had no effect on VERP in LQT1. EPS and optical mapping experiments demonstrated genotype-specific differences in AV conduction and ventricular refractoriness. The occurrence of infra-His blocks in LQT2 rabbits under isoflurane and intra-His block in LQT1 rabbits after dofetilide suggest differential regional sensitivities of the rabbit His-Purkinje system to drugs blocking I(Kr) and I(Ks).


Figures

Fig. 1.
Fig. 1.
A: fluoroscopic image showing catheter placement in right atrium (RA) and right ventricle (RV). B: surface electrocardiogram (ECG) (standard limb leads I, II, aVL, aVF, and chest lead V1) and intracardiac ECG recordings during normal sinus rhythm in male long QT syndrome type 2 (LQT2) rabbit. Note that His bundle electrogram is seen in RVbase electrodes. A, atrial signal; H, His signal; V, ventricular signal.
Fig. 2.
Fig. 2.
A: representative tracing of LQT2 rabbit with atrioventricular (AV) conduction block under isoflurane anesthesia. The His bundle electrogram shows the infra-His level of the AV conduction block. T, T wave. B: representative ECG tracing in littermate control (LMC) under isoflurane: absence of AV block. C: representative ECG tracing of long QT syndrome type 1 (LQT1) under isoflurane: absence of AV block. D: ventricular pacing, and capture during AV 2:1 block, in the LQT2 rabbit shown in A indicates that the block is not due to ventricular refractoriness. E: decremental His conduction and infra-His Wenckebach at 170-ms stimulation cycle length (CL) in LQT2 rabbit. Indicated are durations of HV intervals. F: infra-His effective refractory period (ERP) in LQT2 rabbit at S1 of 240 ms and S2 of 190 ms. RVb, RV base; RVm, RV mid; RVa, RV apex.
Fig. 3.
Fig. 3.
Ventricular effective refractory period (VERP) dispersion and pharmacogenomic effect of isoproterenol on VERP. A: VERP in RV apex and base (at 240 ms stimulation CL) are shown at baseline (colored bars) and during isoproterenol (checkered bars) in LMC (black), LQT1 (blue), and LQT2 (red) rabbits. All values are presented as means ± SD. **P < 0.01. ***P < 0.001. B: VERP dispersion (ms) in LMC, LQT1, and LQT2 rabbits at baseline (colored bars) and during isoproterenol (checked bars). *P < 0.05. C: effect of isoproterenol (100 μM) on slow delayed-rectifier K+ current (IKs) densities. IKs peak current densities in apical myocytes derived from LMC (n = 10 myocytes), LQT2 (n = 10), and LQT1 (n = 9) rabbits are shown at baseline control conditions (black line), during isoproterenol administration (ISO, red line), and after blockade with 50 μM chromanol 293B (green line). Column on left shows typical recordings from single cells, recorded from holding potential of −40 to +30 mV. Column on right shows quantification of IKs current densities (pA/pF) at +10 mV. NS, not significant. *P < 0.05 vs. control conditions. **P < 0.01 vs. ISO.
Fig. 4.
Fig. 4.
Pharmacogenomic effect of dofetilide. A: absolute duration of QT vs. time after dofetilide bolus (0.02 μg/kg) in LMC (black line), LQT1 (blue line), and LQT2 (red line) rabbits. B: duration of RR vs. time after dofetilide bolus. C: heart rate-corrected QT index (QTi) after dofetilide bolus. *P < 0.05 LQT1 vs. LMC. **P < 0.01 LQT1 vs. LMC. Green hatched line indicates expected QTi (100%). D: episode of dofetilide-induced polymorphic ventricular tachycardia (pVT) in LQT1 male during episode of alternating AV 2:1/3:1 block. P, P wave.
Fig. 5.
Fig. 5.
Effect of dofetilide on AV conduction in LQT1 rabbits. A: high-grade AV block (10 min after dofetilide bolus, 0.02 μg/kg) shown at slow paper speed. Note that RR interval depends on QT interval. B: representative ECG tracing of LMC rabbit under dofetilide showing QT prolongation but absence of AV block (10 min after dofetilide bolus). C: representative ECG tracing of LQT2 rabbit under dofetilide: absence of AV block (10 min after dofetilide bolus). D: the inability to pace the ventricle in LQT1 rabbit until after the end of the T wave confirms ventricular refractoriness. Note the T wave alternans. E: His bundle recordings (indicated by arrows) in LQT1 rabbit at baseline and 60 and 70 s after dofetilide bolus. Progressive decrease in amplitude of the His electrogram is seen 60 s after dofetilide bolus. At 70 s, there is a further decrease in amplitude and an increase in duration of the His, infra-His conduction delay with QRS widening, and then a second-degree AV block.
Fig. 6.
Fig. 6.
A: perfused AV node preparation. B: schematic of the optical mapping 4 × 4-mm field of view. C: bipolar HBE (BE) and optical mapping signals (F) in atrial region (yellow), AV node region (light blue), and His region (black) within the 4 × 4-mm field of view. Dotted lines delineate the concordance of the optical signals with the bipolar signals A (atrium), H (His), and V (ventricle). D: activation maps of AV node and His signals. Regions labeled A1 and -2, N1-3, and H1–5 demonstrate points from which signals shown in C were obtained. The field of view of the activation maps shown in Fig. 7, C and D, is indicated by a red square. E: AV junction activation map (i) and corresponding time plot (ii). The red broken line indicates the line drawn from the AV junction toward the end of the His activation, along which we plotted the activation time. Relative activation time is plotted against the distance within the AV junction. “a” indicates region with slow conduction, corresponding to AV node; “b” indicates region with fast conduction, corresponding to His. iii, Immunohistochemical staining of the region corresponding to the optical mapping field of view; Masson's Trichrome (top) and immunohistochemical staining with anti-Neurofilament-70 antibody (bottom).
Fig. 7.
Fig. 7.
A: bipolar electrode signals (BE) at the His location during continuous dofetilide perfusion (10−9 mol/l) showing 2:1 block. The light blue asterisk marks the lack of sharp His deflection upon AV conduction block. B: optical signals (F) from very proximal His location 1 to distal location 5 as indicated in the activation maps below. C1 and C5 indicate the normal His signals of the conducted (C) beat at positions 1 and 5, respectively. B1 and B5 indicate the signals of the blocked (B) beat at positions 1 and 5, respectively. B1 depicts normal His signal at the proximal His, whereas B5 indicates the loss of detectable activation (dF/dt) above noise level at location 5 distal to the intra-His block. C and D: activation map at the His location (indicated are the locations 1–5) of the conducted beat (C) and of the blocked beat (D) as indicated by the red arrows. The size of the optical field is 4 mm (x-axis) × 2 mm (y-axis). Time scale is identical to the time scale in B. The gray scale under the activation maps indicates the different times of the activation. Note the closer spacing of isochronal lines in the activation map of the blocked beat, consistent with slower His conduction. At the blocked beat, at location 5 and beyond, there is loss of smooth activation isochronal lines due to loss of signal. E: AV junction activation maps and time plots for conducted and blocked beats post-dofetilide in LQT1. The red dashed line indicates the line along which we plotted the activation time. Relative activation time is plotted against the distance within the AV junction with slower conduction of the blocked beat (broken line) than the conduced beat (solid line) in the His region (labeled “b”) and, finally, the premature termination of the conduction of the blocked beat.
Fig. 8.
Fig. 8.
AV conduction in LMC and LQT2 rabbits during continuous dofetilide perfusion (10−9 mol/l). A: LMC. B: LQT2. i, Sample traces of His bipolar electrograms (BE) and fluorescence optical recordings (F). Broken lines delineate the concordance of the optical signals with the bipolar signals A, H, and V. ii, Activation maps through the AV node (AVN)/His junction of two consecutive beats (beat 1 and beat 2). The field of view was set to 2 × 4 mm2, and the isochronal lines were drawn at 2-ms intervals, with darker color indicating later activation. iii, Relative activation time plots for consecutive beats 1 and 2. Both groups showed distinct His bipolar electrograms, distinct His upstrokes in the optical signals, and His conduction without block under dofetilide in contrast to the LQT1 group shown in Fig. 7.

References

    1. Ben Caref E, Boutjdir M, Himel HD, El-Sherif N. Role of subendocardial Purkinje network in triggering torsade de pointes arrhythmia in experimental long-QT syndrome. Europace 10: 1218–1223, 2008 - PubMed
    1. Bhandari AK, Shapiro WA, Morady F, Shen EN, Mason J, Scheinman MM. Electrophysiologic testing in patients with the long-QT syndrome. Circulation 71: 63–71, 1985 - PubMed
    1. Brunner M, Guo W, Mitchell GF, Buckett PD, Nerbonne JM, Koren G. Characterization of mice with a combined suppression of Ito and IK,slow. Am J Physiol Heart Circ Physiol 281: H1201–H1209, 2001 - PubMed
    1. Brunner M, Peng X, Liu GX, Ren XQ, Ziv O, Choi BR, Mathur R, Hajjiri M, Odening KE, Steinberg E, Folco E, Pringa E, Centracchio J, Macharzina R, Donahay T, Schofield L, Rana N, Kirk M, Mitchel G, Poppas A, Zehender M, Koren G. Mechanisms of cardiac arrhythmias and sudden death in transgenic rabbits with long-QT syndrome. J Clin Invest 118: 2246–2259, 2008 - PMC - PubMed
    1. Buxton AE, Josephson ME. Role of electrophysiologic studies in identifying arrhythmogenic properties of antiarrhythmic drugs. Circulation 73: II-67–II-72, 1986 - PubMed

Publication types

MeSH terms

LinkOut - more resources