. 2010 Jul 15;213(Pt 14):2494-506.
doi: 10.1242/jeb.041749.

Object preference by walking fruit flies, Drosophila melanogaster, is mediated by vision and graviperception

Affiliations

Object preference by walking fruit flies, Drosophila melanogaster, is mediated by vision and graviperception

Alice A Robie et al. J Exp Biol. .

Abstract

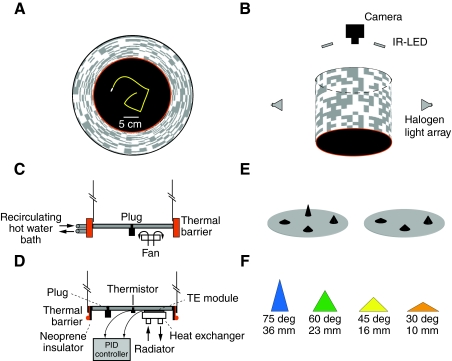
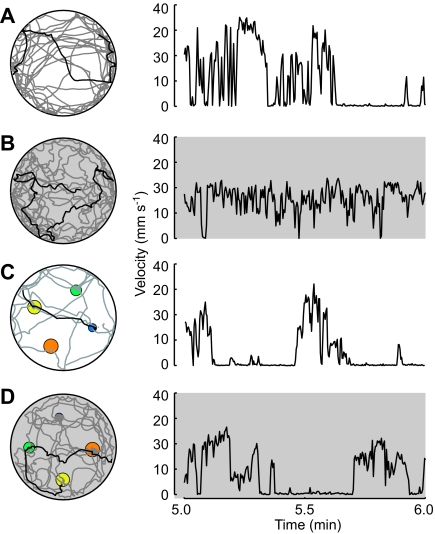
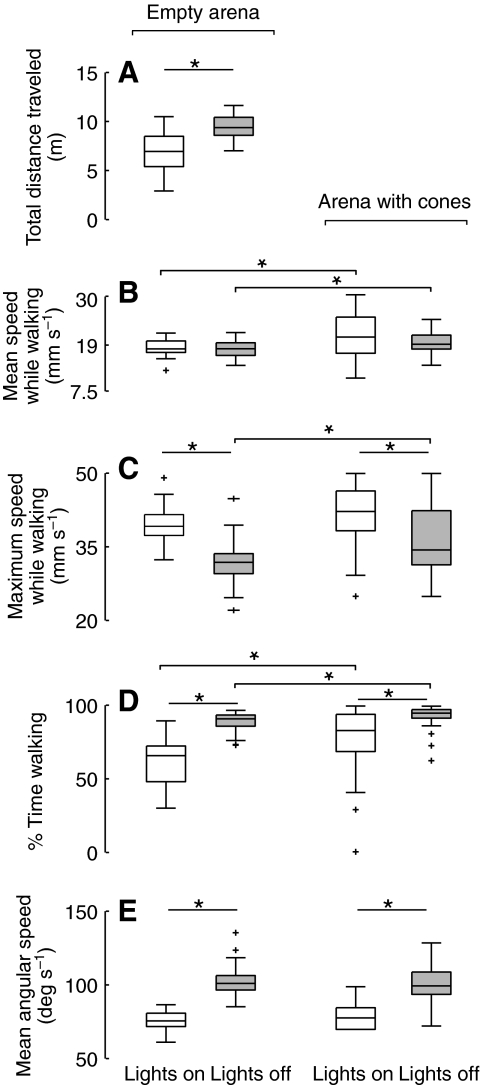
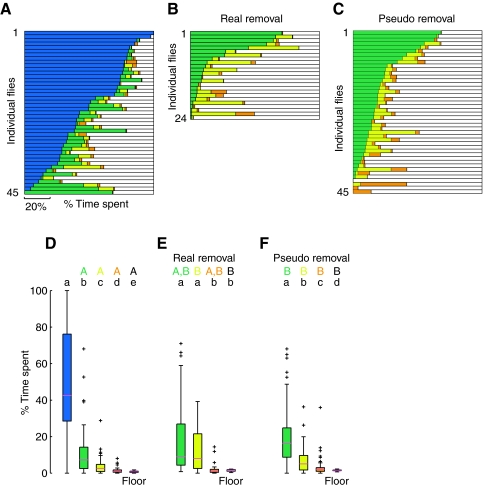
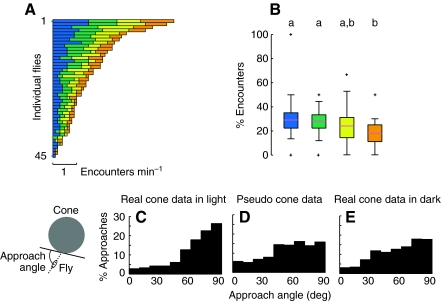
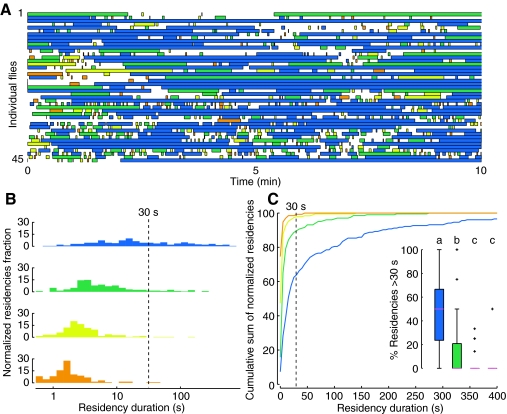
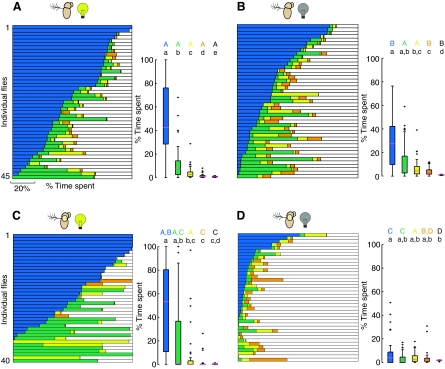
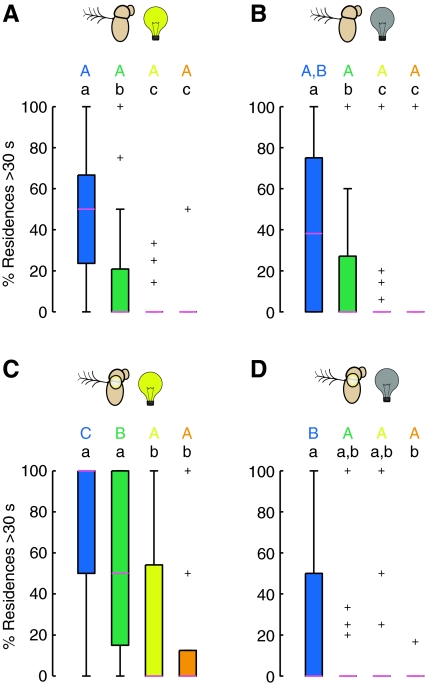
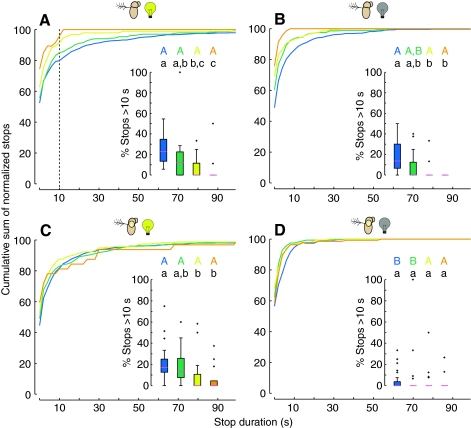
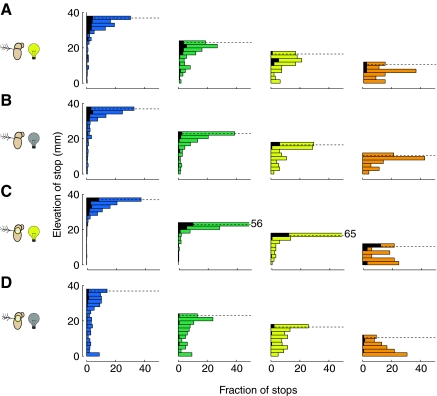
Walking fruit flies, Drosophila melanogaster, use visual information to orient towards salient objects in their environment, presumably as a search strategy for finding food, shelter or other resources. Less is known, however, about the role of vision or other sensory modalities such as mechanoreception in the evaluation of objects once they have been reached. To study the role of vision and mechanoreception in exploration behavior, we developed a large arena in which we could track individual fruit flies as they walked through either simple or more topologically complex landscapes. When exploring a simple, flat environment lacking three-dimensional objects, flies used visual cues from the distant background to stabilize their walking trajectories. When exploring an arena containing an array of cones, differing in geometry, flies actively oriented towards, climbed onto, and explored the objects, spending most of their time on the tallest, steepest object. A fly's behavioral response to the geometry of an object depended upon the intrinsic properties of each object and not a relative assessment to other nearby objects. Furthermore, the preference was not due to a greater attraction towards tall, steep objects, but rather a change in locomotor behavior once a fly reached and explored the surface. Specifically, flies are much more likely to stop walking for long periods when they are perched on tall, steep objects. Both the vision system and the antennal chordotonal organs (Johnston's organs) provide sufficient information about the geometry of an object to elicit the observed change in locomotor behavior. Only when both these sensory systems were impaired did flies not show the behavioral preference for the tall, steep objects.


Figures

Fig. 1.
Fig. 1.
Experimental apparatus. (A) Top-down view of the arena with backlit panorama. The thermal barrier is depicted in red. (B) A schematic side view of the fly visualization setup. Near-IR LEDs (light-emitting diodes) mounted with the camera above the arena, and two of the eight halogen lights arranged in a circular array are depicted. (C) A schematic vertical cross section of Arena 1 with passive cooling. Recirculating hot water heats the thermal barrier and four CPU fans cool the walking platform (only one is depicted). (D) A schematic vertical cross section of Arena 2 with active cooling. The thermal barrier is a strip of galvanized steel wrapped in a rope heater and insulated from the walking platform by a layer of neoprene. The walking platform in actively cooled by a PID-controlled array of four thermoelectric modules with water-cooled heat sinks (only one is depicted). (E) The two arrangements of cones in the arena. The arena floor is shown in grey for illustration purposes only; the floor and cones were both painted matte black. (F) The color-code convention used for the cones of equal lateral surface area. The angle between the base and lateral surface, and the height, are noted below each cone.
Fig. 2.
Fig. 2.
Example trajectories and corresponding velocity plots. Each 10 min trajectory is plotted in gray with the fifth minute plotted in black. The speed profile for that same period is plotted on the right. Trials run in darkness are shown with a gray background. In trajectories with cones present, the footprint of each cone is indicated according the color scheme in Fig. 1F. Representative traces where chosen for the following cases: (A) empty arena with lights on, (B) empty arena in darkness, (C) four cones with lights on, and (D) four cones in darkness.
Fig. 3.
Fig. 3.
Visual information influences the basic statistics of walking. The two leftmost box plots in each panel show data for flies exploring an empty arena in the light (white, N=33) and in the dark (gray, N=33). The two rightmost box plots show data from flies exploring the floor of the arena with cones present in the light (white, N=45) and in darkness (gray, N=45). (A) The total distance traveled by individual flies during a 10 min trial. (B) The mean speed while the flies were walking. (C) The maximum speed calculated while the flies were walking. (D) The percentage of time the flies spent in the walking state, normalized for the total time spent on the floor of the arena when cones were present. (E) The mean angular speed calculated while the flies were walking. Statistically comparisons were made using heteroscedastic two-sample t-tests unless the data were not normally distributed in which case the Mann–Whitney U-test was used (C,D). Asterisks indicate significantly different distributions (P<0.05 with Bonferroni correction) between the indicated pairs of data; crosses denote outliers.
Fig. 4.
Fig. 4.
Flies spend more time on tallest, steepest cone. Color-coded (see Fig. 1F) horizontal bar graphs show the percentage of the 10 min trial that each fly spent on the four cones and the floor of the arena (white). The data are ranked by the time spent on the blue (A) or green (B,C) cone. (A) Data for trials with all four cones present (N=45). (B) Data from trials in which the tallest, steepest (blue) cone was removed from the arena (N=24). (C) ‘Pseudo removal’ data created by scaling the data from (A) after excluding visits to the blue cone (see text for details; N=45). (D–F) The distributions of the data in A, B, and C respectively, are shown after normalizing for area of the surfaces being explored. The results of statistical tests are indicated with a letter code; groups labeled with the same letter are not statistically different and a group can have more than one label, indicating that group(s) with any of the same letter are not significantly different (for more details see methods). Across trial statistical tests compare a given cone type across experimental conditions and the results are denoted with uppercase letters of the color indicating the cone type being compared (color code from Fig. 1F and uppercase black letter=arena floor). Comparisons were made using a Mann–Whitney U-test with Bonferroni correction, P<0.05. Within trial statistical tests compare the different cone types in a given experimental condition and homogenous groups are denoted with lowercase black letters. Comparisons were made using Wilcoxon's signed-ranks test with Bonferroni correction, P<0.05.
Fig. 5.
Fig. 5.
Flies encounter objects of differing geometry at similar rates. (A) Horizontal bar plots indicate the encounter rates of each cone type for each fly, ranked according to total encounter rate. (B) Box plots show the percentage of encounters for each cone type (N=45). See Fig. 1F for color code. The Wilcoxon signed rank test for non-independent, non-normal data was used to compare groups (P<0.05 with Bonferroni correction for multiple comparisons). See Fig. 4 for explanation of letter codes for homogeneous groups; crosses denote outliers. (C) The frequency distribution of approach angles to all cone types in the light. (D) The frequency distribution of approach angles to pseudo cones footprints created from the data set in which no cones were present. (E) The frequency distribution of approach angles to all cone types in the dark.
Fig. 6.
Fig. 6.
Flies exhibit long residency times on the tallest, steepest cone. (A) Each row represents the time series data of a single fly (N=45). The color (see Fig. 1F) indicates the identity of the cone the fly resides on and white spaces indicate periods spent on the arena floor. (B) Normalized frequency distribution of log of the residency durations by all flies on each cone type from data plotted in A. (C) Cumulative sums of the normalized frequency distribution of all residency durations by all flies. The inset shows the distribution of the percentage of individual flies' residency times longer than 30 s. Statistical comparisons were made using a Kolmogorov–Smirnov two-sample test (P<0.05, with Bonferroni correction); crosses denote outliers. See Fig. 4 for explanation of letter codes for homogenous groups.
Fig. 7.
Fig. 7.
Sensory manipulations influence flies' preference for the tallest, steepest cone. Horizontal bar graphs show the percentage of the 10-min trial that each fly spent on each of the four cones and the arena floor (as in Fig. 4). Box plots show distribution of data after dividing by the surface area, which was identical for each cone. (A) Intact flies in the light (N=45). (B) Intact flies in complete darkness (N=45). (C) Flies with antennae immobilized in the light (N=40). (D) Flies with antennae immobilized in complete darkness (N=40). See Fig. 4 for description of statistical analysis and explanation of letter codes for homogenous groups. Crosses denote outliers.
Fig. 8.
Fig. 8.
Sensory manipulations influence residency times. The percentage of residency durations that were longer than 30 s under four experimental conditions. See Fig. 1F for color code. (A) Intact flies in the light (N=45). (B) Intact flies in complete darkness (N=45). (C) Flies with antennae immobilized in the light (N=40). (D) Flies with antennae immobilized in complete darkness (N=40). Statistically significant differences within and across trials were determined using the Kolmogorov–Smirnov two-sample test (P<0.05, with Bonferroni correction); crosses denote outliers. See Fig. 4 for explanation of letter codes for homogenous groups.
Fig. 9.
Fig. 9.
Sensory manipulations affect the percentage of time spent stopped on cones. Color-coded (see Fig. 1F) box plots indicate the percentage of time stopped on each surface of the arena, with white indicating the arena floor. (A) Intact flies in the light (N=25). (B) Intact flies in complete darkness (N=25). (C) Flies with antennae immobilized in the light (N=40). (D) Flies with antennae immobilized in complete darkness (N=40). Statistically significant differences within and across trials were determined using the Mann–Whitney U-test (P<0.05, with Bonferroni correction); crosses denote outliers. See Fig. 4 for explanation of letter codes for homogenous groups.
Fig. 10.
Fig. 10.
Sensory manipulations influence distributions of stop durations. Each panel shows cumulative sums of the normalized distribution of stop durations, with insets showing the percentage of individual flies' stop durations that were longer than 10 s (see Fig. 6C). See Fig. 1F for color code. (A) Intact flies in the light (N=25). (B) Intact flies in complete darkness (N=25). (C) Flies with antennae immobilized in the light (N=40). (D) Flies with antennae immobilized in complete darkness (N=40). Statistically significant differences within and across trials were determined using the Kolmogorov–Smirnov two-sample test (P<0.05, with Bonferroni correction); crosses denote outliers. See Fig. 4 for explanation of letter codes for homogenous groups.
Fig. 11.
Fig. 11.
Flies tend to stop at the top of the cones. Horizontal bar graphs show the fraction of all stops (colored) and long stops (black) that were performed at a given elevation. Each column represents the stops on a given cone type, color code as in Fig. 1F. The dashed black line in each column is the height of the top of that cone; stop elevations can be taller than the height of the cone because we included the flies' body height (1 mm) in our 3-D model. Each row is a different sensory condition: (A) intact flies in the light (N=25), (B) intact flies in complete darkness (N=25), (C) flies with antennae immobilized in the light (N=40) and (D) flies with antennae immobilized in complete darkness (N=40). In C, the top bin of the green and yellow histograms is truncated at 50% for presentation purposes; the real values are 56% (green) and 65% (yellow).

Similar articles

Cited by

References

    1. Armstrong J. D., Texada M. J., Munjaal R., Baker D. A., Beckingham K. M. (2006). Gravitaxis in Drosophila melanogaster: a forward genetic screen. Genes, Brain Behav. 5, 222-239 - PubMed
    1. Baker D. A., Beckingham K. M., Armstrong J. D. (2007). Functional dissection of the neural substrates for gravitaxic maze behavior in Drosophila melanogaster. J. Comp. Neurol. 501, 756-764 - PubMed
    1. Beckingham K. M., Texada M. J., Baker D. A., Munjaal R., Armstrong J. D. (2005). Genetics of graviperception in animals. Adv. Genet. 55, 105-145 - PubMed
    1. Bell W. J. (1991). Searching Behaviour: the Behavioural Ecology of Finding Resources New York: Chapman and Hall;
    1. Branson K., Robie A. A., Bender J., Perona P., Dickinson M. H. (2009). High-throughput ethomics in large groups of Drosophila. Nat. Methods 6, 451-457 - PMC - PubMed

Publication types