. 2010 Jun;22(6):1686-701.
doi: 10.1105/tpc.110.074187. Epub 2010 Jun 25.

Megabase level sequencing reveals contrasted organization and evolution patterns of the wheat gene and transposable element spaces

Affiliations

Megabase level sequencing reveals contrasted organization and evolution patterns of the wheat gene and transposable element spaces

Frédéric Choulet et al. Plant Cell. 2010 Jun.

Abstract

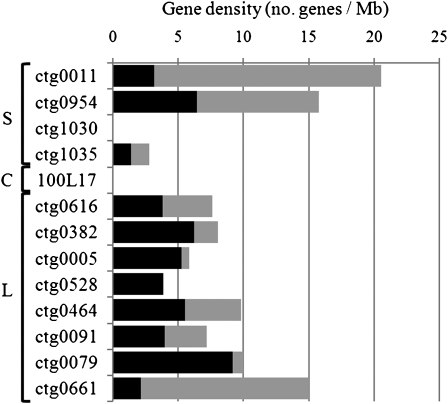
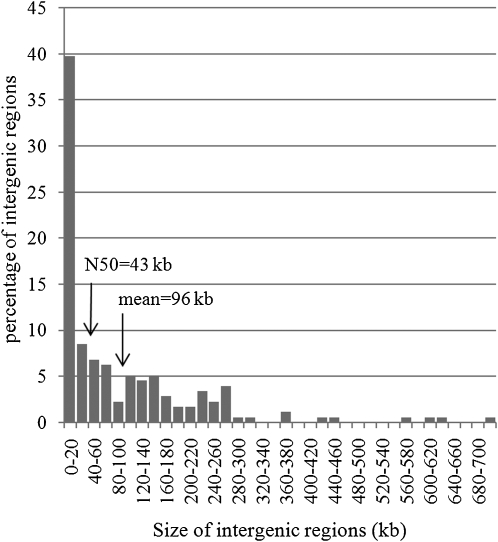
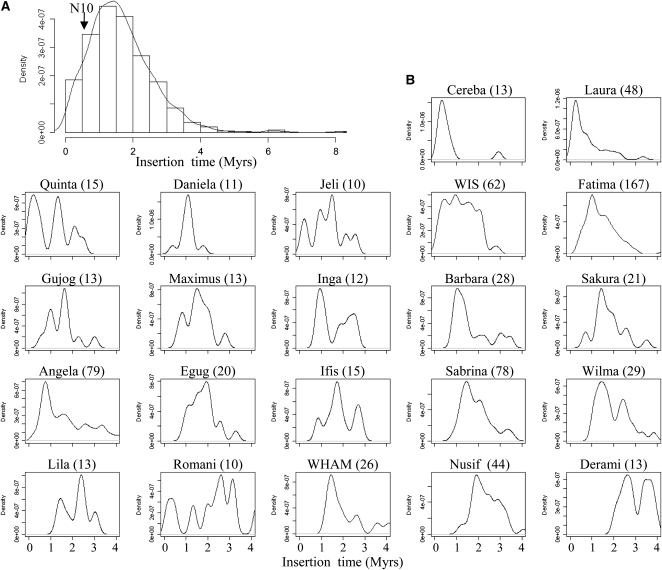
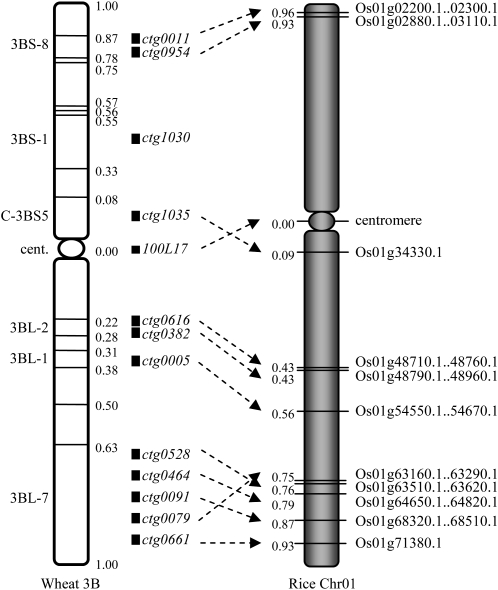
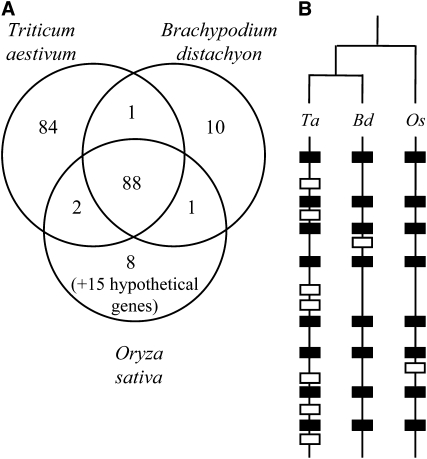
To improve our understanding of the organization and evolution of the wheat (Triticum aestivum) genome, we sequenced and annotated 13-Mb contigs (18.2 Mb) originating from different regions of its largest chromosome, 3B (1 Gb), and produced a 2x chromosome survey by shotgun Illumina/Solexa sequencing. All regions carried genes irrespective of their chromosomal location. However, gene distribution was not random, with 75% of them clustered into small islands containing three genes on average. A twofold increase of gene density was observed toward the telomeres likely due to high tandem and interchromosomal duplication events. A total of 3222 transposable elements were identified, including 800 new families. Most of them are complete but showed a highly nested structure spread over distances as large as 200 kb. A succession of amplification waves involving different transposable element families led to contrasted sequence compositions between the proximal and distal regions. Finally, with an estimate of 50,000 genes per diploid genome, our data suggest that wheat may have a higher gene number than other cereals. Indeed, comparisons with rice (Oryza sativa) and Brachypodium revealed that a high number of additional noncollinear genes are interspersed within a highly conserved ancestral grass gene backbone, supporting the idea of an accelerated evolution in the Triticeae lineages.


Figures

Figure 1.
Figure 1.
Gene Density and Level of Synteny along the 13 Contigs. Gene density calculated for the 13 sequenced contigs displayed according to their chromosomal location from the top to the bottom (S, short arm; C, centromeric region; L, long arm). Densities of the syntenic (black) and locus-specific (gray) genes are represented and expressed in number of genes per megabases.
Figure 2.
Figure 2.
Distribution of the Size of the 176 IGDs. The x axis displays the different size intervals for the IGDs, while the y axis presents the percentage of intergenic regions found for each size interval. The mean (96 ± 128 kb) and median (42.5 kb) values are indicated by arrows.
Figure 3.
Figure 3.
Ages of LTR-Retrotransposon Insertions. Distribution of the age of the insertion of 880 complete LTR retrotransposons (A) and the 13 most abundant LTR retrotransposon families (B). The insertion time was calculated based on the LTR sequence divergence using a substitution rate of 1.3 × 10⁻⁸ substitutions/site/year (Ma and Bennetzen, 2004). For each family, the number of complete copies used to calculate the insertion pattern is indicated in brackets. The cutoff value of 0.5 million years (Myrs) distinguishing the 10% of youngest elements (N10) is indicated with an arrow.
Figure 4.
Figure 4.
Chromosomal Location of the 13 Sequenced Contigs from the Wheat 3B Chromosome and Their Orthologous Regions on Chromosome 1 of Rice. The boundaries of 16 deletion bins are indicated by horizontal lines across the 3B chromosome, and their distances from the centromere are expressed as a fraction of length of chromosomal arms. In rice chromosome 1, the first and last genes carried by the orthologous regions are indicated. Their distances from the centromere were calculated using a centromere position at 16.8 Mb (http://rice.plantbiology.msu.edu/pseudomolecules/centromere.shtml). The relative order of the contigs in bin 3BL7-0.63-1.00 was determined by genetic mapping (data not shown).
Figure 5.
Figure 5.
Level of Synteny between Wheat, Rice and B. distachyon Genomes. (A) Venn diagram of the syntenic and nonsyntenic genes between wheat, rice, and B. distachyon. Fifteen additional hypothetical rice genes that do not share any similarity within the sequence databanks and represent putative prediction errors are mentioned on the diagram. All other nonsyntenic genes identified (84 in wheat, 10 in B. distachyon, and 8 in rice) have homologs in the compared species. (B) Schematic representation of orthologous chromosomes displaying orthologous (black) and nonsyntenic (white) genes in wheat (Ta), B. distachyon (Bd), and rice (Os).

Comment in

References

    1. Akhunov E.D., Akhunova A.R., Dvorak J. (2007). Mechanisms and rates of birth and death of dispersed duplicated genes during the evolution of a multigene family in diploid and tetraploid wheats. Mol. Biol. Evol. 24: 539–550 - PubMed
    1. Akhunov E.D., et al. (2003a). Synteny perturbations between wheat homoeologous chromosomes caused by locus duplications and deletions correlate with recombination rates. Proc. Natl. Acad. Sci. USA 100: 10836–10841 - PMC - PubMed
    1. Akhunov E.D., et al. (2003b). The organization and rate of evolution of wheat genomes are correlated with recombination rates along chromosome arms. Genome Res. 13: 753–763 - PMC - PubMed
    1. Altschul S.F., Madden T.L., Schaffer A.A., Zhang J., Zhang Z., Miller W., Lipman D.J. (1997). Gapped BLAST and PSI-BLAST: A new generation of protein database search programs. Nucleic Acids Res. 25: 3389–3402 - PMC - PubMed
    1. Arabidopsis Genome Initiative (2000). Analysis of the genome sequence of the flowering plant Arabidopsis thaliana. Nature 408: 796–815 - PubMed

Publication types

LinkOut - more resources