. 2010 Aug 4;29(15):2646-58.
doi: 10.1038/emboj.2010.131. Epub 2010 Jun 25.

Hedgehog controls neural stem cells through p53-independent regulation of Nanog

Affiliations

Hedgehog controls neural stem cells through p53-independent regulation of Nanog

Agnese Po et al. EMBO J. .

Abstract

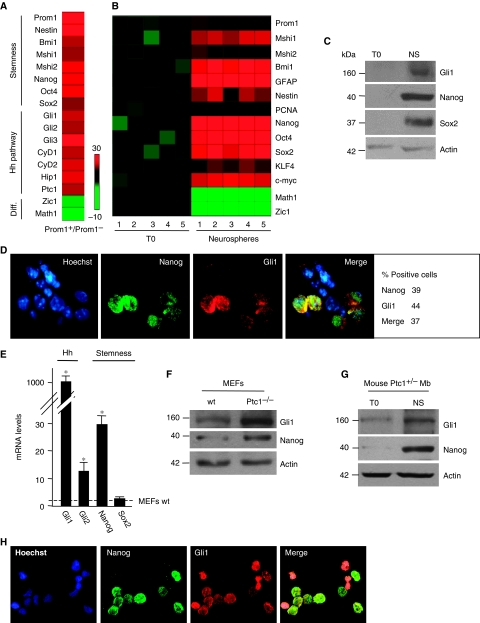
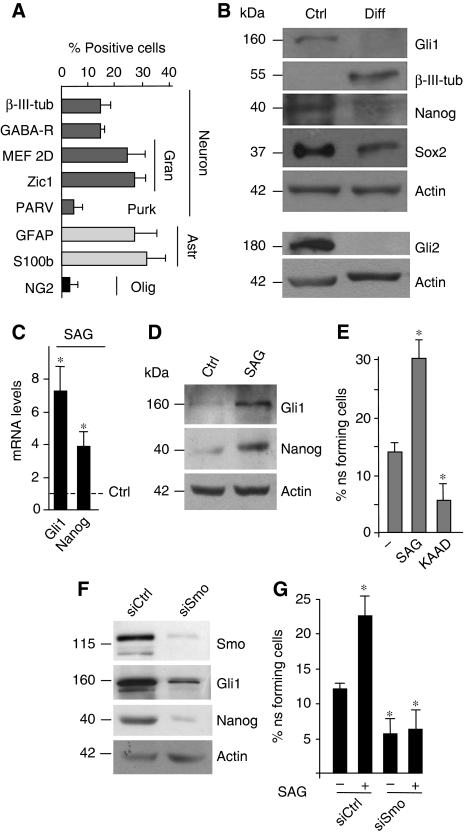
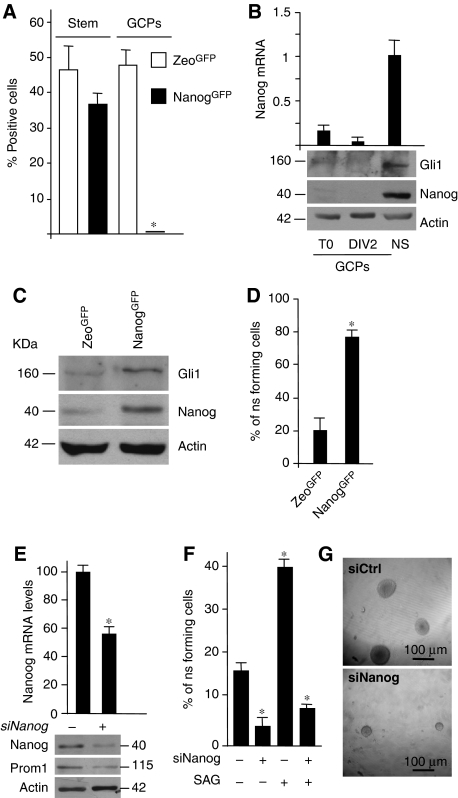
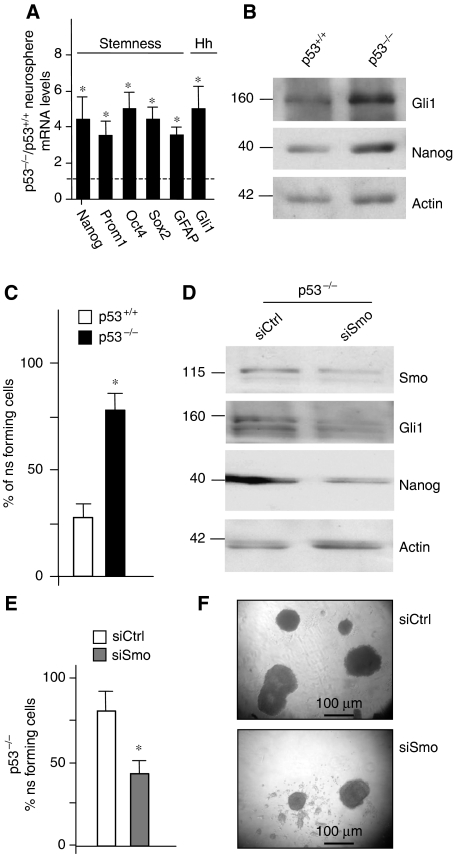
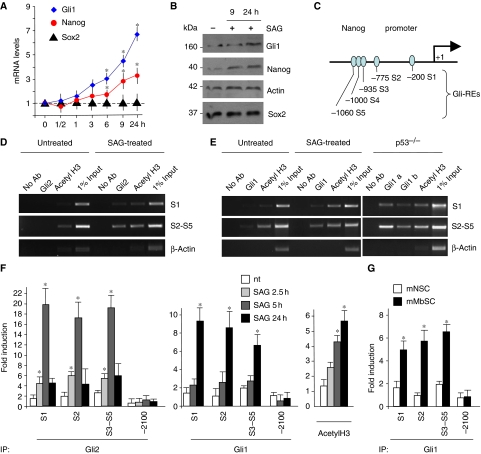
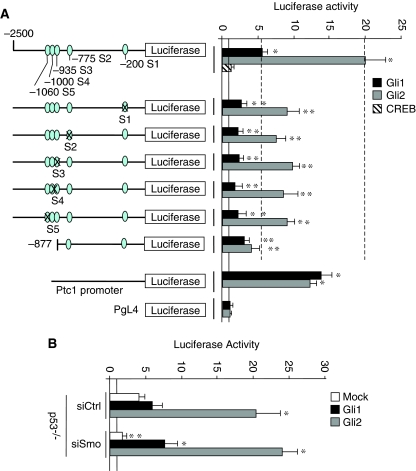
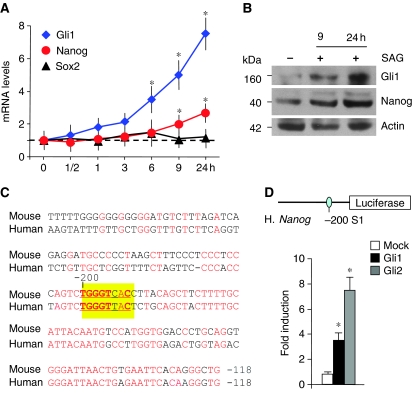
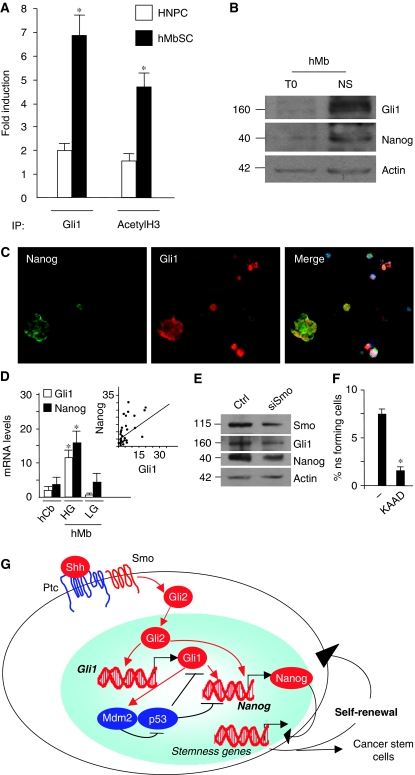
Hedgehog (Hh) pathway has a pivotal function in development and tumorigenesis, processes sustained by stem cells (SCs). The transcription factor Nanog controls stemness acting as a key determinant of both embryonic SC self-renewal and differentiated somatic cells reprogramming to pluripotency, in concert with the loss of the oncosuppressor p53. How Nanog is regulated by microenvironmental signals in postnatal SC niches has been poorly investigated. Here, we show that Nanog is highly expressed in SCs from postnatal cerebellum and medulloblastoma, and acts as a critical mediator of Hh-driven self-renewal. Indeed, the downstream effectors of Hh activity, Gli1 and Gli2, bind to Nanog-specific cis-regulatory sequences both in mouse and human SCs. Loss of p53, a key event promoting cell stemness, activates Hh signalling, thereby contributing to Nanog upregulation. Conversely, Hh downregulates p53 but does not require p53 to control Nanog. Our data reveal a mechanism for the function of Hh in the control of stemness that represents a crucial component of an integrated circuitry determining cell fate decision and involved in the maintenance of cancer SCs.


Conflict of interest statement

The authors declare that they have no conflict of interest.

Figures

Figure 1
Figure 1
Cerebellar neurospheres coexpress Nanog and Gli1. (A, B) Heat map of RT–qPCR gene expression (stemness, Hh pathway and differentiation (Diff) markers) of FACS-sorted Prominin1+ versus Prominin1 cells from eight cerebella of 4-day-old mice (three representative experiments) (A) or 24 h cultured cerebellar cells (T0) versus derived neurospheres (B). A red–green colour scale (−10 to +30) depicts markers expression normalized to three housekeeping genes. (C) Western blot analysis of endogenous Gli1 and stemness markers levels in cerebellar cells (T0) and derived neurospheres (NS). (D) Immunofluorescence or nuclear Hoechst (blue) staining with Nanog (green), Gli1 (red) or both antibodies in disgregated neurospheres from murine cerebellum. The relative percentage of either Nanog or Gli1 or double-positive (marked) cells is indicated on the right. (E) mRNA levels evaluated by RT–qPCR of Hh (Gli1, Gli2) or stemness (Nanog, Sox2) markers in mouse embryonic fibroblasts (MEFs) Ptc1−/− respect to wild-type MEFs (wt). *P<0.05 versus wild-type MEFs. (F) Western blot analysis of Gli1 and Nanog levels in Ptc1 wt versus Ptc1−/− MEFs. (G) Western blot analysis of endogenous Gli1 and Nanog in Mb cells (T0) and derived neurospheres (NS). (H) Immunofluorescence or nuclear Hoechst (blue) staining with Nanog (green) and Gli1 (red) antibodies in disgregated neurospheres from mouse Ptc1+/− Mb.
Figure 2
Figure 2
Function of Hh–Gli and Nanog in cerebellar neurospheres. (A, B) Percentage of positive cells detected with immunofluorescence staining (A) or western blot (B) with the indicated antibodies in neurospheres cultured in D-poly-ornithine-coated chamber slides with N2 medium plus PDGF (10 ng/ml) for 7 days (A, Gran, Granule cells; Purk, Purkinje cells; Astr, astrocytes; Olig, oligodendrocytes) (B, differentiated (Diff)). (C, D) mRNA (C) and protein levels (D) of Gli1 and Nanog evaluated by RT–qPCR or western blot relative to housekeeping controls, in neurospheres before (Ctrl) and after 48-h SAG treatment. (E) Neurosphere-forming assay of single cells derived from secondary neurospheres cultured in basal stem medium (−) or in the presence of SAG or KAAD cyclopamine for 10 days. (F, G) Western blot (F) or neurosphere-forming assay (G) after transfection with control (siCtrl) or Smo siRNA (siSmo) in the absence or in the presence of SAG for 10 days. *P<0.05 versus untreated cells.
Figure 3
Figure 3
Nanog is required for Hh-induced NSC self-renewal. (A) Histograms showing the percentage of GFP+ cells in postnatal cerebellar secondary neurospheres (NS) and GCPs 48 h after infection with Nanog-GFP or Zeo-GFP control lentiviral vector. *P<0.05 versus Zeo-GFP-positive cells. (B) mRNA and protein levels of Nanog and Gli1 in neurospheres (NS) or GCPs before (T0) or after 2 days culture (DIV2). (C) Western blots of Gli1 and Nanog in Nanog-GFP versus Zeo-GFP-sorted neurosphere-derived cells. (D) Secondary neurosphere-forming assay of GFP-sorted cells as in panel (A). (E) mRNA (upper panel) and protein levels (bottom panel) of Nanog and Prominin1 in neurospheres after siRNA-mediated silencing of Nanog (siNanog +) versus control siRNA (−). (F) Secondary neurosphere-forming assay after control siRNA (siCtrl) or Nanog siRNA (siNanog), treated (+) or not (−) with SAG. *P<0.05 versus untreated or Zeo-GFP cells. (G) Representative bright field images of cerebellar neurosphere after transfection with control siRNA (siCtrl) or Nanog siRNA (siNanog).
Figure 4
Figure 4
Hh regulates stem cell self-renewal through a p53-independent pathway. (A, B) RT–qPCR (A) and western blot (B) analysis of stemness markers and Gli1 in neurospheres from p53-deficient mouse cerebella (p53−/−). (A) Results are expressed as mean values of five different neurosphere cultures from p53−/− mice with respect to p53+/+ wild type (dashed line). (C) Secondary neurosphere-forming assay of p53−/− cells with respect to cells from p53 wild-type mice. (D) Western blot analysis of Smo, Gli1 and Nanog in p53−/− neurospheres after transfection with siRNA against Smo (siSmo) compared with control siRNA (Ctrl). (E, F) Secondary neurosphere-forming assay (E) and representative bright field images (F) of cerebellar p53−/− cells after transfection with siRNA against Smo (siSmo) or control siRNA (siCtrl). *P<0.05 versus untreated p53+/+ cells (A, C) or siCtrl (E).
Figure 5
Figure 5
Hh/Gli activate Nanog transcription. (A, B) RT–qPCR (A) and western blot (B) analysis of Nanog, Sox2 and Gli1 levels in neurosphere cultures after SAG treatment up to 24 h (means±s.d. from four different experiments). *P<0.05 versus untreated cells. (C) Representation of Nanog promoter showing putative Gli-responsive elements (GliRE). (DF) ChIP (D, E) and real-time qPCR-ChIP (F) assays from untreated (nt), 2.5 h (F), 5 h (D, F) and 24 h (E, F) SAG-treated neurospheres or p53−/− neurospheres (E), using anti-Gli2 (D, F) or anti-Gli1 (two different antibodies, see Materials and methods and panels (E, F)) and anti-acetyl-H3 antibodies. Eluted DNA was PCR amplified with primers shown in Supplementary Figure S4B. Real-time qPCR-ChIP results are expressed as fold induction versus endogenousβ-actin-amplified ChIP controls. Bars represent the mean of three independent experiments±s.d. (*P<0.05 versus nt). (G) RT–qPCR ChiP assay from untreated murine cerebellar neurospheres (mNSC) and murine medulloblastoma-derived neurospheres (mMbSC) using anti-Gli1 antibody. Eluted DNA was PCR amplified with primers shown in Supplementary Figure S4B. Bars represent the mean of three independent experiments±s.d. (*P<0.05 versus mNSC). A full-colour version of this figure is available at The EMBO Journal Online.
Figure 6
Figure 6
Transcriptional activity of Gli-responsive sites of Nanog promoter. (A) Relative luciferase activity driven by either mouse Nanog (−2500/+1 bp) or (−877/+1 bp) region or (−2500/+1 bp) reporter constructs carrying either mutagenized S1 to S5 Gli consensus sequences (indicated in Supplementary Figure S3A) or Ptc1 promoter/reporter or PgL4 empty vector, transfected into mouse cerebellar neurospheres together with mock (continuous line), Gli1, Gli2 or CREB (as a negative control). Data are indicated as mean ratios with respect to pRL-CMV-Renilla Luciferase control (ctrl). *P<0.05 versus Ctrl. **P<0.05 versus wild-type constructs (dashed lines). (B) Relative luciferase activity driven by Nanog promoter in p53−/− compared with p53 wt neurospheres (continuous line). The day before Gli1 and Gli2 overexpression, cells were transfected with siRNA against Smo (siSmo) or control. *P<0.05 versus Mock-transfected cells; **P<0.05 versus siCtrl.
Figure 7
Figure 7
Conservation of human Nanog regulation by Hh. (A, B) RT–qPCR (A) of Nanog, Sox2 and Gli1 levels and western blot analysis (B) of Nanog and Gli1 levels in HNPC after SAG treatment up to 24 h (means±s.d. from four different experiments). *P<0.05 versus untreated cells. (C) Alignment of mouse and human Nanog upstream cis-regulatory sequences, showing a good homology in the −256 to −118 bp region, encompassing a conserved Gli consensus site at −200 bp. (D) Relative luciferase activity driven by human Nanog (−2586/+1 bp) reporter transfected into human HNPC together with Mock, Gli1 and Gli2. Data are indicated as mean ratios with respect to pRL-CMV-Renilla Luciferase control (ctrl). *P<0.05 versus ctrl. A full-colour version of this figure is available at The EMBO Journal Online.
Figure 8
Figure 8
Hh-dependent activation of Nanog in human Mb stem cells. (A) RT–qPCR ChiP assay from untreated HNPC and human Mb-derived neurospheres (hMbSCs) derived neurospheres with anti-Gli1 and anti-acetyl-H3 antibodies. Eluted DNA was PCR amplified with primers shown in Supplementary Figure S4B. Results are expressed as fold induction versus endogenous GAPDH-amplified ChIP controls. Bars represent the mean of three independent experiments±s.d. (*P<0.05 versus HNPC). (B) Protein levels of endogenous Nanog and Gli1 evaluated by western blot in cells derived from human Mb (T0) versus derived neurospheres (NS). (C) Immunofluorescence or nuclear Hoechst (blue) staining with Nanog (green) and Gli1 (red) antibodies in disgregated neurospheres from human Mb. (D) mRNA levels of Nanog and Gli1, evaluated by RT–qPCR relative to housekeeping controls, in human hMb samples (subsets expressing high (HG) or low levels (LG) of Gli1) and cerebellar controls (hCb). *P<0.05 in HG versus LG versus hCb. Inset: Regression analysis of Nanog versus Gli1 levels in 28 human Mb samples (P<0.01 by simple regression analysis). (E) Western blot analysis of endogenous Gli1, Smo and Nanog levels in human Mb neurospheres after siRNA-mediated silencing of Smo (siSmo) versus control siRNA (ctrl). (F) Neurosphere-forming assay of single cells derived from secondary human Mb neurospheres in basal stem medium (−), in the presence of Hh antagonist KAAD cyclopamine for 15 days. *P<0.05 versus untreated. (G) Schematic model of the regulatory loop between Hh and Nanog in cerebellar NSCs. Shh binds to Ptc1, releasing the inhibition on Smo, which in turn enhances Gli2 nuclear translocation and recruitment to promoters of target genes Gli1 and Nanog. Gli1 and p53 form a reciprocal inhibitory loop. Hh signal through Gli1 activates the E3 Ligase Mdm2, which degrades p53 protein, thus relieving its inhibitory activities on both Nanog promoter and Gli1 (see text). In turn, Gli1 and Gli2 bind to specific consensus cis-regulatory responsive elements on Nanog promoter enhancing its transcription. In this way, they mediate the Hh- and p53-dependent control of Nanog and downstream stemness genes, which promote self-renewal of NSCs and cancer SCs of Hh-induced tumors (e.g. Mb).

Comment in

References

    1. Abe Y, Oda-Sato E, Tobiume K, Kawauchi K, Taya Y, Okamoto K, Oren M, Tanaka N (2008) Hedgehog signaling overrides p53-mediated tumor suppression by activating Mdm2. Proc Natl Acad Sci USA 105: 4838–4843 - PMC - PubMed
    1. Ahn S, Joyner AL (2005) In vivo analysis of quiescent adult neural stem cells responding to Sonic Hedgehog. Nature 437: 894–897 - PubMed
    1. Boiani M, Scholer HR (2005) Regulatory networks in embryo-derived pluripotent stem cells. Nat Rev Mol Cell Biol 6: 872–884 - PubMed
    1. Brambrink T, Foreman R, Welstead GG, Lengner CJ, Wernig M, Suh H, Jaenisch R (2008) Sequential expression of pluripotency markers during direct reprogramming of mouse somatic cells. Cell Stem Cell 2: 151–159 - PMC - PubMed
    1. Canettieri G, Di Marcotullio L, Greco A, Coni S, Antonucci L, Infante P, Pietrosanti L, De Smaele E, Ferretti E, Miele E, Pelloni M, De Simone G, Pedone EM, Gallinari P, Giorgi A, Steinkuhler C, Vitagliano L, Pedone C, Schinin ME, Screpanti I et al. (2010) Histone deacetylase and Cullin3-REN(KCTD11) ubiquitin ligase interplay regulates Hedgehog signalling through Gli acetylation. Nat Cell Biol 12: 132–142 - PubMed

Publication types

MeSH terms