. 2010 Jul 8;466(7303):267-71.
doi: 10.1038/nature09145. Epub 2010 Jun 27.

Single-cell NF-kappaB dynamics reveal digital activation and analogue information processing

Affiliations

Single-cell NF-kappaB dynamics reveal digital activation and analogue information processing

Savaş Tay et al. Nature. .

Abstract

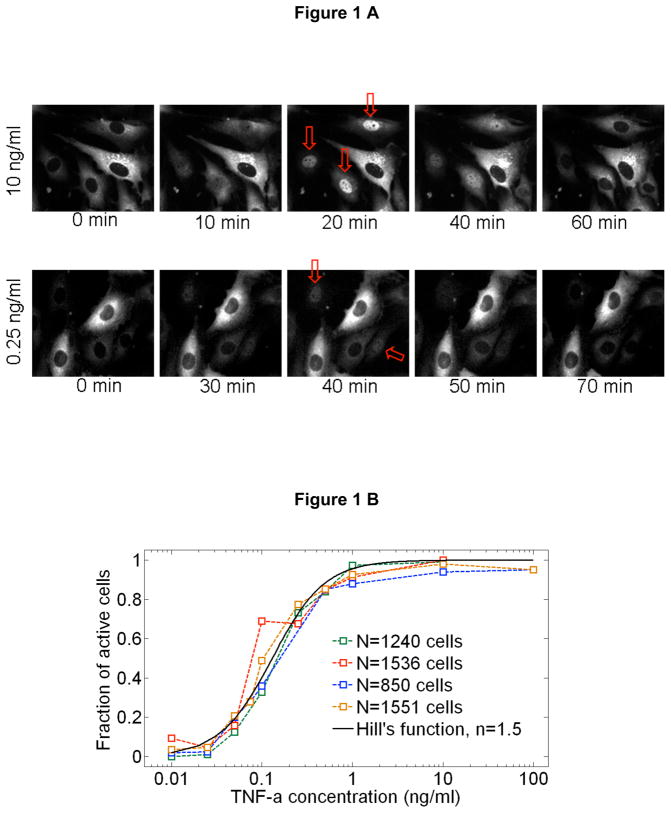
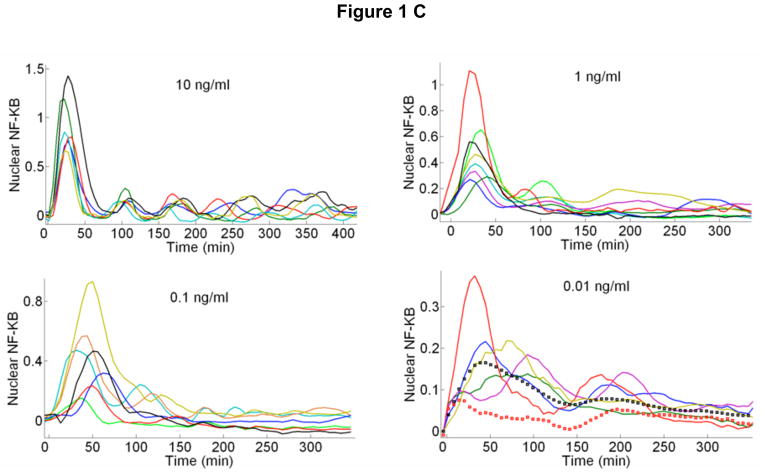
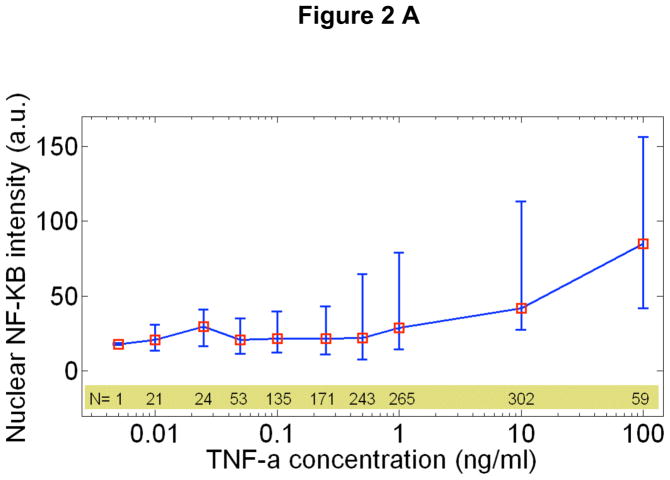
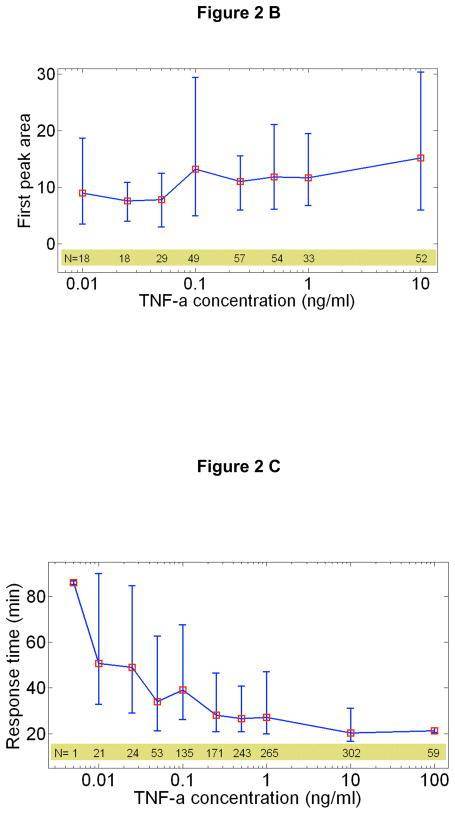
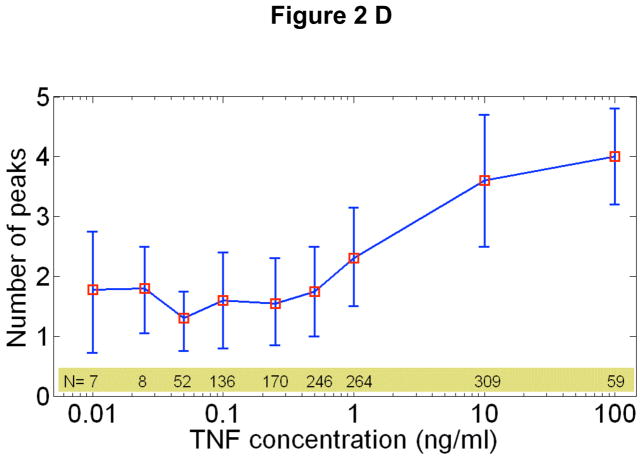
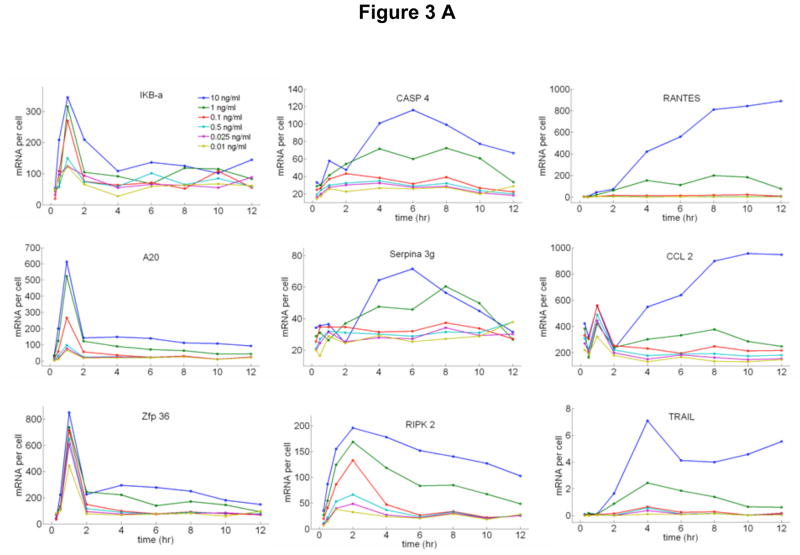
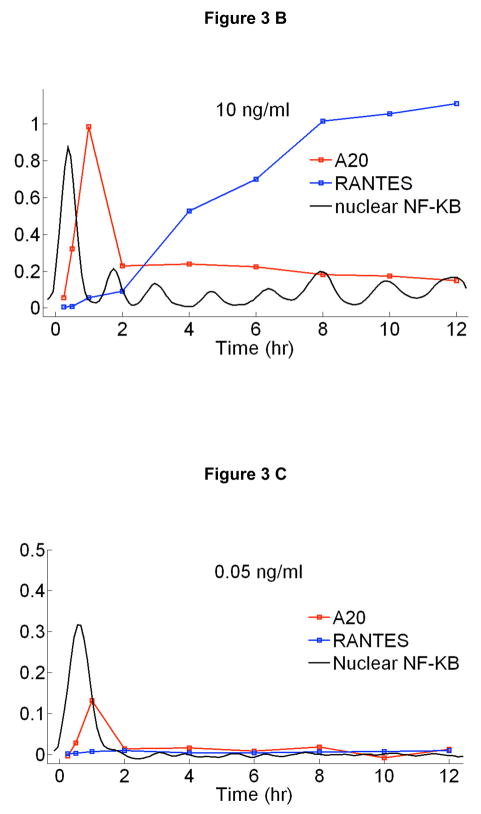
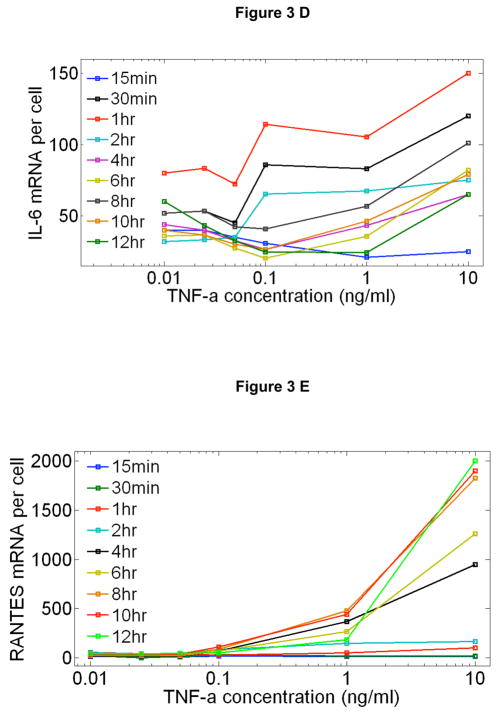
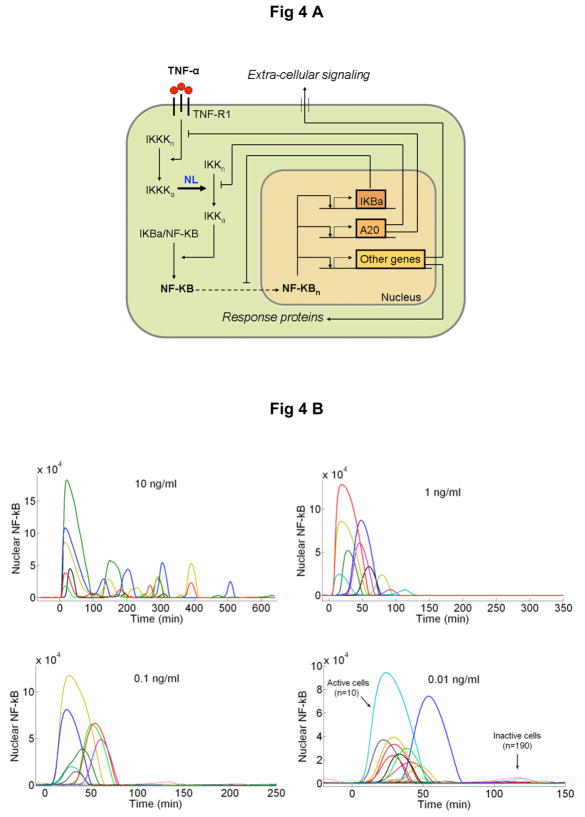
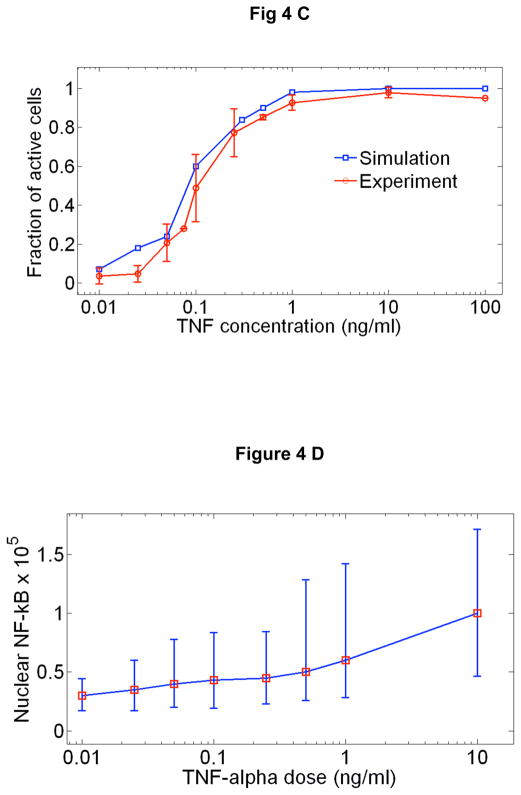
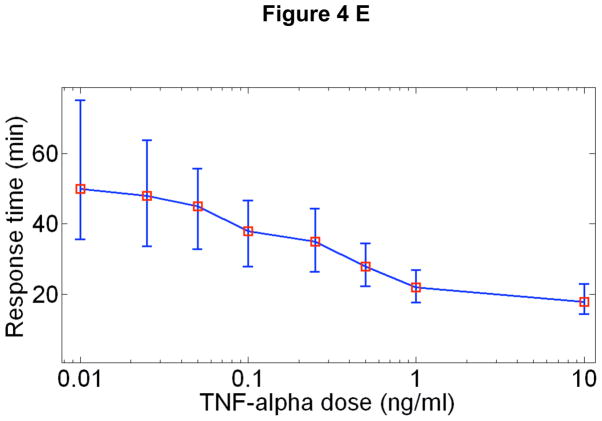
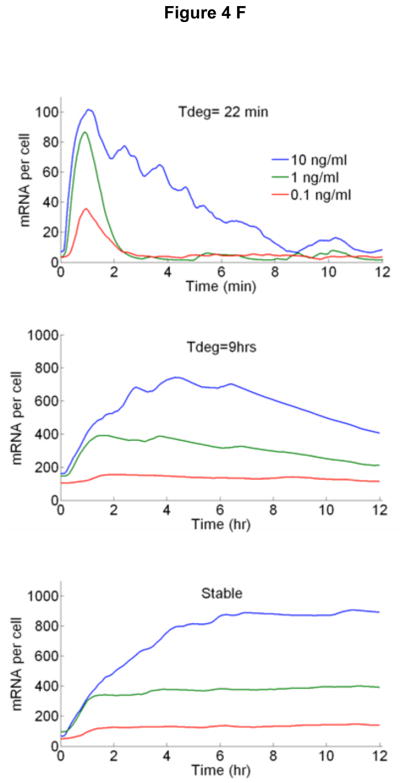
Cells operate in dynamic environments using extraordinary communication capabilities that emerge from the interactions of genetic circuitry. The mammalian immune response is a striking example of the coordination of different cell types. Cell-to-cell communication is primarily mediated by signalling molecules that form spatiotemporal concentration gradients, requiring cells to respond to a wide range of signal intensities. Here we use high-throughput microfluidic cell culture and fluorescence microscopy, quantitative gene expression analysis and mathematical modelling to investigate how single mammalian cells respond to different concentrations of the signalling molecule tumour-necrosis factor (TNF)-alpha, and relay information to the gene expression programs by means of the transcription factor nuclear factor (NF)-kappaB. We measured NF-kappaB activity in thousands of live cells under TNF-alpha doses covering four orders of magnitude. We find, in contrast to population-level studies with bulk assays, that the activation is heterogeneous and is a digital process at the single-cell level with fewer cells responding at lower doses. Cells also encode a subtle set of analogue parameters to modulate the outcome; these parameters include NF-kappaB peak intensity, response time and number of oscillations. We developed a stochastic mathematical model that reproduces both the digital and analogue dynamics as well as most gene expression profiles at all measured conditions, constituting a broadly applicable model for TNF-alpha-induced NF-kappaB signalling in various types of cells. These results highlight the value of high-throughput quantitative measurements with single-cell resolution in understanding how biological systems operate.


Figures

Fig 1
Fig 1
A Real-time fluorescent images of live cells during stimulation with 10 ng/ml (top row) and 0.25 ng/ml (bottom row) TNF-α. Arrows show the activated cells. At the high dose, all cells except one respond, while only two out of five respond at the lower dose. B Fraction of activated cells vs. TNF-α concentration for four different experiments. 10 different TNF-α concentrations were measured in a single experiment simultaneously using parallel chambers, with nearly 1000 cells quantified in each experiment (N=number of quantified active cells in this experiment). The mean of four experiments fit to a Hill function with n=1.5. C Representative traces for active cells. Also shown (bottom right) are mean traces at 0.01ng/ml TNF-α stimulation, when only active cells are included (black squares), and when both active and non-active cells are included (red squares). The traces averaged over all cells (N~80) misleadingly shows reduced activity. When only active cells are considered, the averaged intensity level faithfully represent the single cell intensities, but individual temporal dynamics are inevitably washed out, showing the importance of single cell data.
Fig 1
Fig 1
A Real-time fluorescent images of live cells during stimulation with 10 ng/ml (top row) and 0.25 ng/ml (bottom row) TNF-α. Arrows show the activated cells. At the high dose, all cells except one respond, while only two out of five respond at the lower dose. B Fraction of activated cells vs. TNF-α concentration for four different experiments. 10 different TNF-α concentrations were measured in a single experiment simultaneously using parallel chambers, with nearly 1000 cells quantified in each experiment (N=number of quantified active cells in this experiment). The mean of four experiments fit to a Hill function with n=1.5. C Representative traces for active cells. Also shown (bottom right) are mean traces at 0.01ng/ml TNF-α stimulation, when only active cells are included (black squares), and when both active and non-active cells are included (red squares). The traces averaged over all cells (N~80) misleadingly shows reduced activity. When only active cells are considered, the averaged intensity level faithfully represent the single cell intensities, but individual temporal dynamics are inevitably washed out, showing the importance of single cell data.
Fig 2
Fig 2
NF-κB response characteristics at different TNF-α doses. Error bars indicate the standard deviation from the median response time, and are indicative of the natural variation in single cell response. A Peak nuclear p65/dsRed localization intensity vs. TNF-α concentration. The median peak intensity (red squares) changes by only a factor of four with in response to four orders of magnitude change in TNF-α concentration. B The integrated area under the first peak vs. TNF concentration for a single experiment, showing that the total NF-κB nuclear activity in the first peak remains constant. C Response time vs. TNF-α concentration. The cells activate faster for higher concentrations. D Number of nuclear localization oscillations vs. TNF-α concentration.
Fig 2
Fig 2
NF-κB response characteristics at different TNF-α doses. Error bars indicate the standard deviation from the median response time, and are indicative of the natural variation in single cell response. A Peak nuclear p65/dsRed localization intensity vs. TNF-α concentration. The median peak intensity (red squares) changes by only a factor of four with in response to four orders of magnitude change in TNF-α concentration. B The integrated area under the first peak vs. TNF concentration for a single experiment, showing that the total NF-κB nuclear activity in the first peak remains constant. C Response time vs. TNF-α concentration. The cells activate faster for higher concentrations. D Number of nuclear localization oscillations vs. TNF-α concentration.
Figure 3
Figure 3
Time dependent expression profiles of NF-κB target genes under TNF-α stimulation with doses ranging from 10ng/ml to 0.01ng/ml, measured on cell populations containing nearly 500 cells in each measurement. Relative expression levels were measured using RT-PCR and calibrated to number of mRNA per cell using digital-PCR. A Early, B Intermediate and C Late genes. D Expression profiles of an early (A20) and late gene (RANTES) compared to NF-κB nuclear localization dynamics. All measurements were under 10 ng/ml TNF-α stimulation. Initial NF-κB nuclear translocation results in a burst of mRNA synthesis for both genes, and the late term expression follows persistent NF-κB oscillations. E Expression profiles of an early and late gene compared to NF-κB nuclear localization dynamics under 0.05 ng/ml TNF-α stimulation. The lack of persistent NF-κB oscillations results in reduced early expression (i.e. fewer cells activating), and the late expression is completely diminished. F, G Expression levels of an early (F) and late (G) gene normalized to the fraction of active cells measured at different times after stimulation. mRNA levels at different concentrations were normalized to single cell level by scaling with the active fraction of cells at that concentration. The early gene expression (F) changes only by two-fold in response to a 1000 fold change in TNF-α concentration, showing that early gene activation is independent of inducing TNF-α concentration. The expression of the late gene (G) is heavily concentration dependent, showing expression only at the highest TNF-α concentrations.
Figure 3
Figure 3
Time dependent expression profiles of NF-κB target genes under TNF-α stimulation with doses ranging from 10ng/ml to 0.01ng/ml, measured on cell populations containing nearly 500 cells in each measurement. Relative expression levels were measured using RT-PCR and calibrated to number of mRNA per cell using digital-PCR. A Early, B Intermediate and C Late genes. D Expression profiles of an early (A20) and late gene (RANTES) compared to NF-κB nuclear localization dynamics. All measurements were under 10 ng/ml TNF-α stimulation. Initial NF-κB nuclear translocation results in a burst of mRNA synthesis for both genes, and the late term expression follows persistent NF-κB oscillations. E Expression profiles of an early and late gene compared to NF-κB nuclear localization dynamics under 0.05 ng/ml TNF-α stimulation. The lack of persistent NF-κB oscillations results in reduced early expression (i.e. fewer cells activating), and the late expression is completely diminished. F, G Expression levels of an early (F) and late (G) gene normalized to the fraction of active cells measured at different times after stimulation. mRNA levels at different concentrations were normalized to single cell level by scaling with the active fraction of cells at that concentration. The early gene expression (F) changes only by two-fold in response to a 1000 fold change in TNF-α concentration, showing that early gene activation is independent of inducing TNF-α concentration. The expression of the late gene (G) is heavily concentration dependent, showing expression only at the highest TNF-α concentrations.
Fig 4
Fig 4
A New mathematical model architecture based on stochastic receptor and gene binding and second order nonlinear IKK activity. B Model simulations of NF-κB nuclear localization at the experimentally measured TNF-α concentration range. The low dose (0.01 ng/ml) stimulated cells show clear separation between active and non active cells, similar to those observed in experiments. The response times and the peak intensities agree well with the data at all doses. The model faithfully reproduces: C The fraction of activate cells, D Nuclear NF-κB intensities and, E Response times vs. TNF-α concentration. Error bars in are standard deviation from median and show the distribution of simulated traces. F Simulations of early (top), intermediate (middle) and late (bottom) genes under various doses of TNF-α. Simulations were done at different transcript degradation times (Tdeg).
Fig 4
Fig 4
A New mathematical model architecture based on stochastic receptor and gene binding and second order nonlinear IKK activity. B Model simulations of NF-κB nuclear localization at the experimentally measured TNF-α concentration range. The low dose (0.01 ng/ml) stimulated cells show clear separation between active and non active cells, similar to those observed in experiments. The response times and the peak intensities agree well with the data at all doses. The model faithfully reproduces: C The fraction of activate cells, D Nuclear NF-κB intensities and, E Response times vs. TNF-α concentration. Error bars in are standard deviation from median and show the distribution of simulated traces. F Simulations of early (top), intermediate (middle) and late (bottom) genes under various doses of TNF-α. Simulations were done at different transcript degradation times (Tdeg).

References

    1. Alberts B, et al. The Molecular Biology of the Cell. 5. Chap 25. Garland Science; Abington, UK: 2008. p. 1539.
    1. Batchelor E, Loewer A, Lahav G. The ups and downs of p53: understanding protein dynamics in single cells. Nature Reviews Cancer. 2009;9:371–277. - PMC - PubMed
    1. Spencer SL, Gaudet S, Albeck JG, Burke JM, Sorger PK. Non-genetic origins of cell-to-cell variability in TRAIL-induced apoptosis. Nature. 2009;459:428–432. - PMC - PubMed
    1. Lahav G, Rosenfeld N, Sigal A, Geva-Zatorsky N, Levine AJ, Elowitz MB, Alon U. Dynamics of the p53-mdm2 feedback loop in individual cells. Nature Genetics. 2004;36:147. - PubMed
    1. Covert MW, Leung TH, Gaston JE, Baltimore D. Achieving stability of lipopolysaccharide-induced NF-kappaB activation. Science. 2005;309:1854–1857. - PubMed

Publication types

MeSH terms