. 2010 Aug;6(8):621-9.
doi: 10.1038/nchembio.400. Epub 2010 Jun 27.

Transcriptional regulation by small RNAs at sequences downstream from 3' gene termini

Affiliations

Transcriptional regulation by small RNAs at sequences downstream from 3' gene termini

Xuan Yue et al. Nat Chem Biol. 2010 Aug.

Abstract

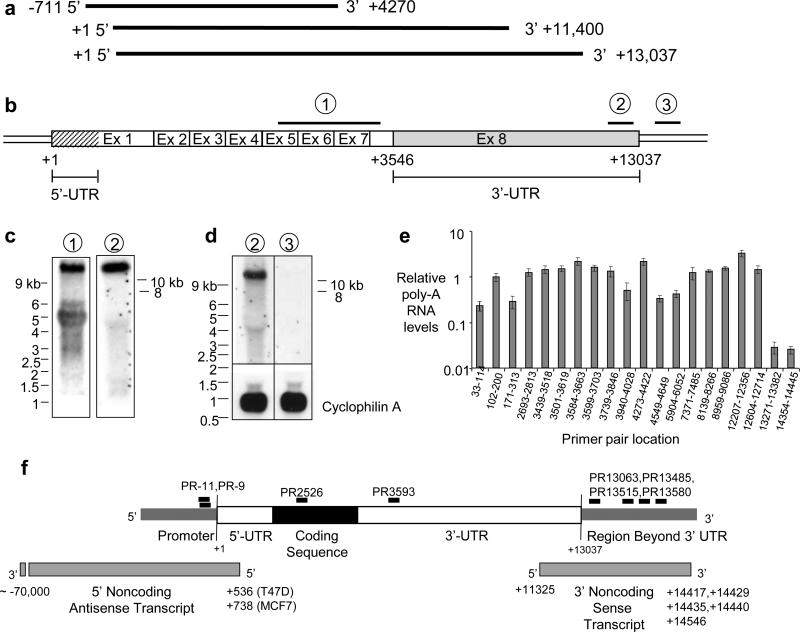
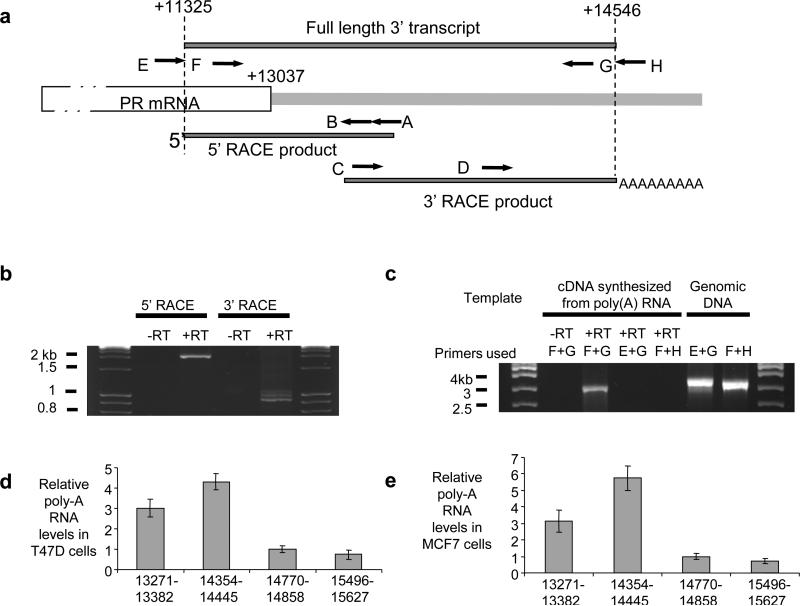
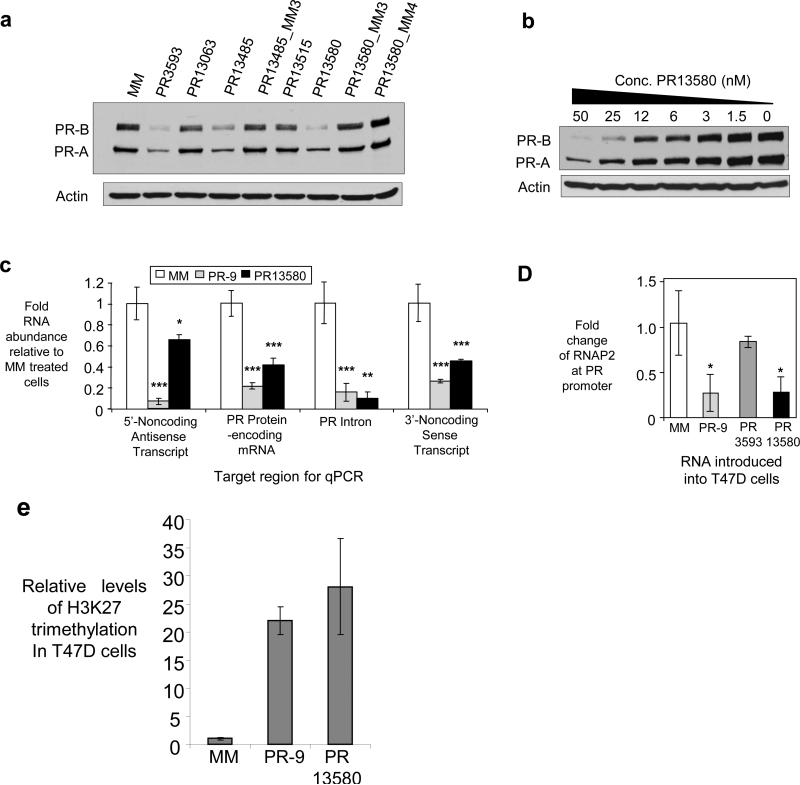
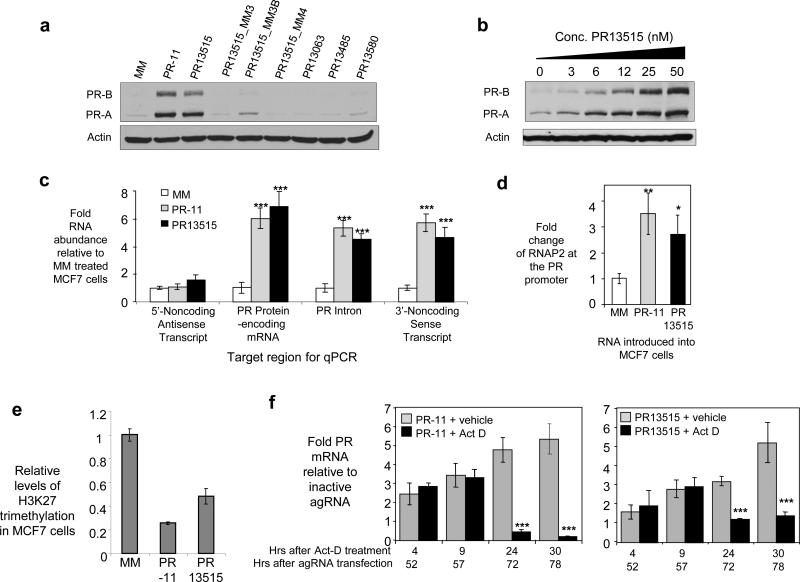
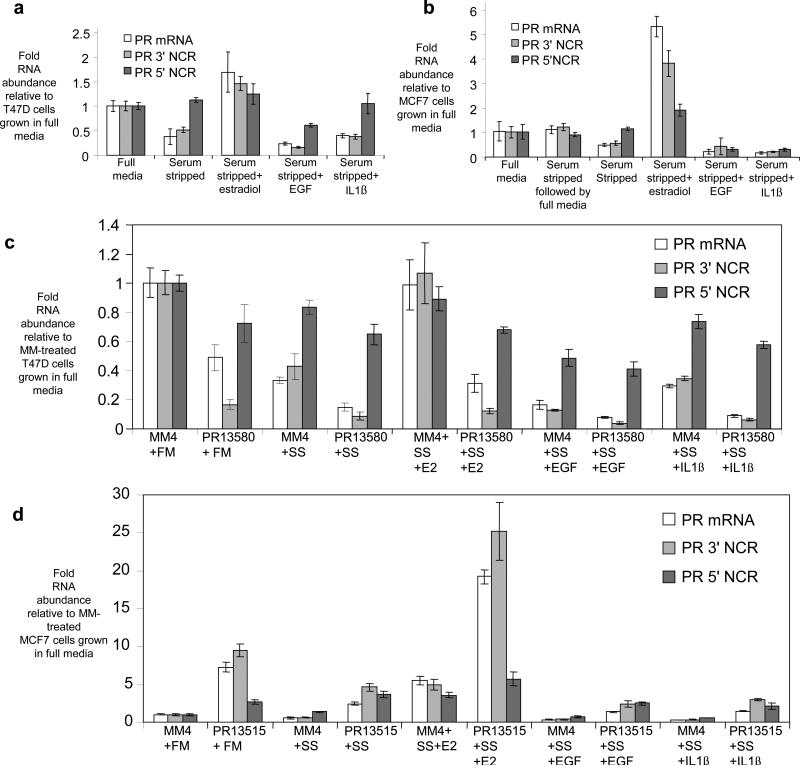
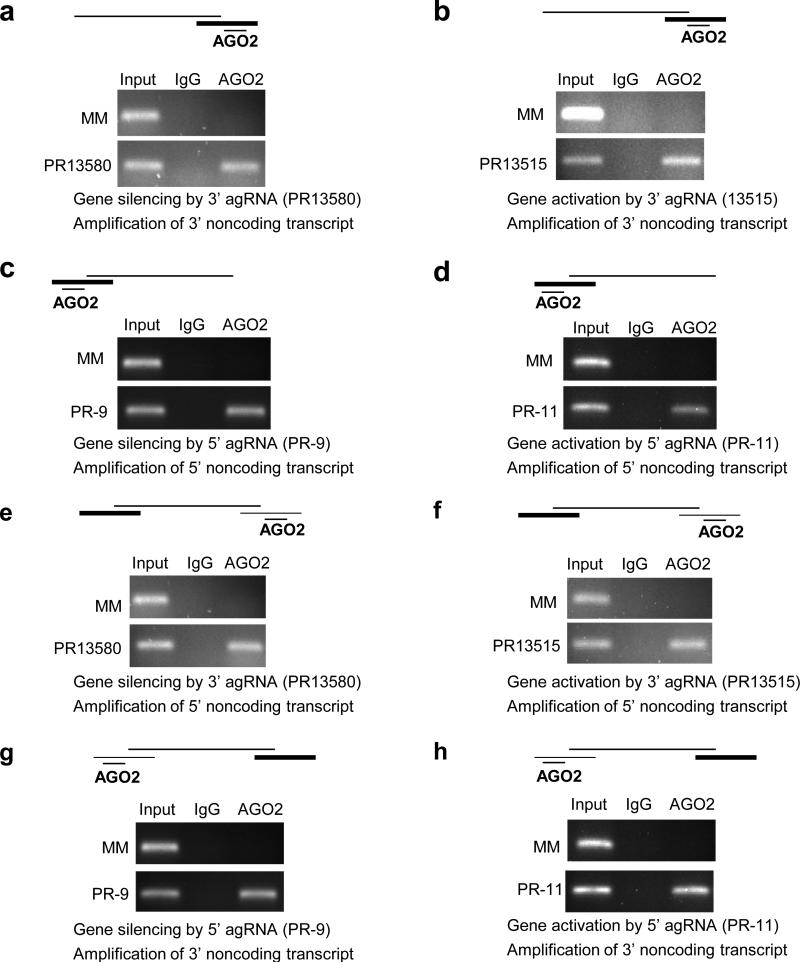
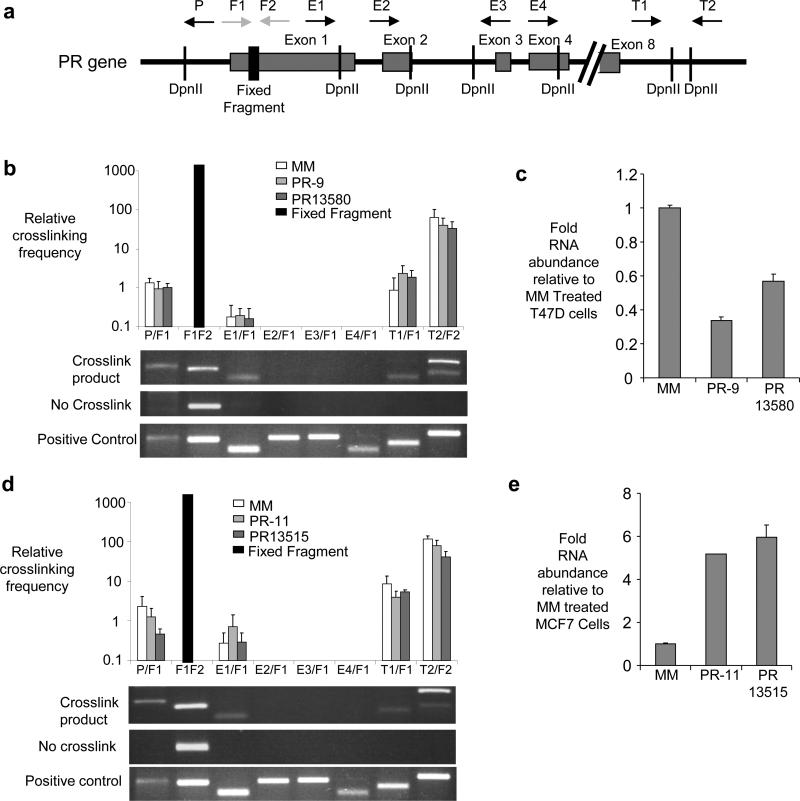
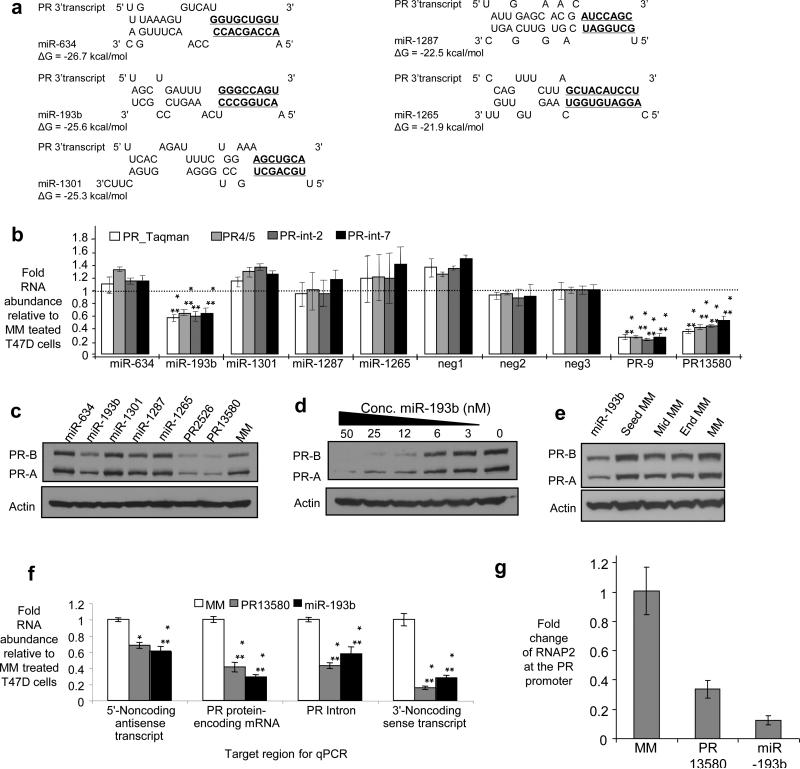
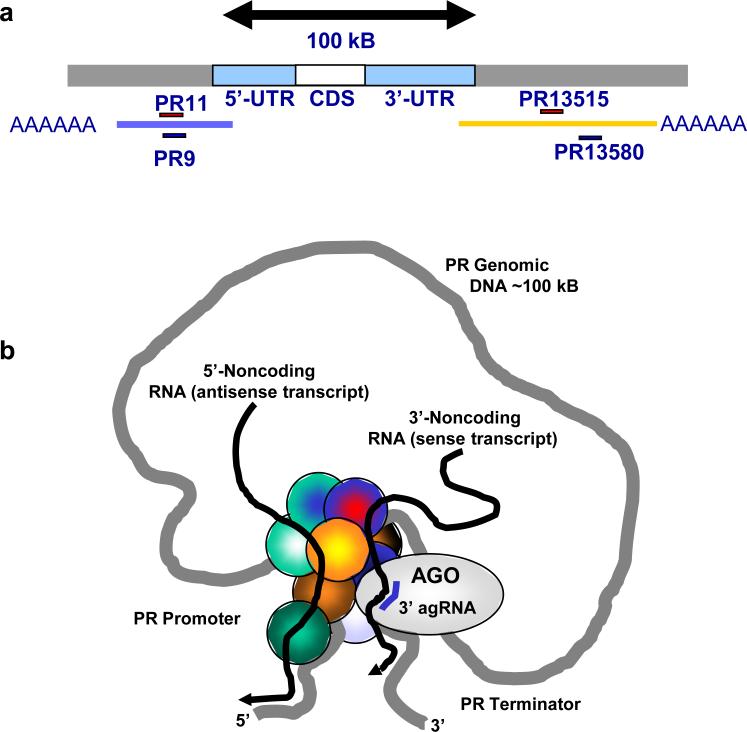
Transcriptome studies reveal many noncoding transcripts overlapping 3' gene termini. The function of these transcripts is unknown. Here we have characterized transcription at the progesterone receptor (PR) locus and identified noncoding transcripts that overlap the 3' end of the gene. Small RNAs complementary to sequences beyond the 3' terminus of PR mRNA modulated expression of PR, recruited argonaute 2 to a 3' noncoding transcript, altered occupancy of RNA polymerase II, induced chromatin changes at the PR promoter and affected responses to physiological stimuli. We found that the promoter and 3' terminal regions of the PR locus are in close proximity, providing a potential mechanism for RNA-mediated control of transcription over long genomic distances. These results extend the potential for small RNAs to regulate transcription to target sequences beyond the 3' termini of mRNA.


Figures

Figure 1
Figure 1. Characterization of PR mRNA
(a) Differing annotations of PR mRNA. Top: pre-2008 GenBank (NM_000926.3); Middle: Predicted largest transcript based on Northern analysis in published reports; Bottom: Current GenBank (NM_000926.4). (b) Schematic of PR mRNA predicted by GenBank and locations of probes for Northern analysis. (c) Northern analysis of PR mRNA comparing results using probes that detect PR mRNA (probe 1) or targeting the 3’ termini of PR mRNA (probe 2), (d) Northern analysis of PR mRNA using probe 2 or a probe immediately downstream of the potential mRNA terminus (probe 3). (e) qPCR showing levels of poly-A RNA in T47D cells detected from the PR transcription start site (+1) past the most downstream annotated terminus of PR mRNA. Notation indicates target region for PCR primers. Data is the resultant of triplicate independent experiments. (f) Location of target sequences for duplex RNAs relative to PR mRNA. The 5’ and 3’ noncoding transcripts that overlap the transcription start site and polyadenylation site are shown.
Figure 2
Figure 2. Characterization of the PR 3’ noncoding transcript
(a) Location of RACE (A,B,C, and D) or RT-PCR (E,F,G, and H) primers relative to PR mRNA and the 3’ noncoding transcript. (b) Agarose gel analysis of RACE products. Total RNA used in RACE was treated with DNase prior to reverse transcription. (c) Agarose gel analysis of RT-PCR amplification using primers E, F, G, and H as shown. Poly(A) RNA was DNase-treated prior to reverse transcription. Amplification of genomic DNA was included as a positive control for primer function. Complete data including sequencing of amplified products is shown in Supplementary Figure S3. qPCR of relative RNA levels in (d) T47D cells and (e) MCF7 cells using primer sets upstream or downstream of the predicted +14,546 termini of the 3’ noncoding transcript (also see Supplementary Figure S1). −RT: RNA samples that were not treated with reverse transcriptase (−RT) were used as negative control. +RT: Reverse transcriptase added. Data is the result of triplicate independent experiments.
Figure 3
Figure 3. Inhibition of PR expression in T47D cells by agRNAs complementary to sequences downstream from the terminus of PR mRNA
(a) Western analysis showing inhibition of protein expression by duplex RNAs (50 nM). (b) Dose response for PR13580. (c) qPCR showing reduction of PR mRNA levels by duplex RNAs (25 nM). Four different primer sets were used, each complementary to different regions of the PR gene (Supplementary Table 4). (d) Presence of RNAP2 at the PR transcription start site (25 nM duplex RNA) evaluated by ChIP. (e) Chromatin immunoprecipitation for the H3K27 trimethylation (H3K27me3) marker within the PR gene locus in T47D cells. ***p<0.005, **p<0.01, and *p<0.05 as compared to cells treated with a mismatch RNA. p-values were calculated using the two-tailed unpaired Student’s T-test with equal variances. All error bars represent standard deviation. Data in parts (a), (c) and (c) is the result of triplicate independent experiments. Data in part (b) is representative of duplicate experiments.
Figure 4
Figure 4. Enhanced PR expression in MCF7 cells by an RNA complementary to a sequence downstream from the terminus of the PR 3’-UTR
(a) Western analysis showing activation of protein expression by duplex RNAs. (b) Dose response for RNA PR13515. (c) qPCR showing effect on RNA levels. Four different primer sets were used, each complementary to different regions near the PR gene. (d) Recruitment of RNAP2 to the PR promoter upon addition of PR13515 or PR-11 evaluated by ChIP. (e) Chromatin immunoprecipitation for the H3K27 trimethylation (H3K27me3) marker within the PR gene locus in MCF7 cells. (f) MCF7 cells were transfected with either PR-11 or PR13515. After two days, actinomycin D (act D, 1 μg/ml) or vehicle was added to the media. Cells were harvested at the indicated timepoints (hours) after actinomycin D or vehicle treatment. Data were normalized to levels of 18S rRNA that did not significantly change for the duration of the experiment. Standard deviation was calculated from 4-6 samples per treatment group. ***p<0.005, **p<0.01, and *p<0.05 as compared to cells treated with RNA MM. p-values were calculated using the two-tailed unpaired Student's T-test with equal variances. All error bars represent standard deviation. Duplex RNAs were added to cells at 25 nM unless otherwise noted. Data in parts (a) - (d) are the results of triplicate experiments. Data in part (f) was the result of 4-6 independent experiments.
Figure 5
Figure 5. Effect of physiologic stimuli or effect of combining physiologic stimuli with addition of agRNAs on expression of PR mRNA, the 3’ noncoding RNA, and the 5’ noncoding RNA
qPCR analysis showing the effect of physiologic stimuli on transcript expression in (a) T47D cells and (b) MCF7 cells. For the sample labeled “serum stripped followed by full media” cells were grown in serum stripped media. The media was replaced by full media for one day prior to harvesting. qPCR analysis of the effect of physiologic stimuli and agRNA (25 nM) addition on transcript expression in (c) T47D cells and (d) MCF7 cells. PR 3’NCR: 3’ noncoding PR RNA. PR 5’NCR: 5’ noncoding PR RNA. SS: Serum-stripped media. FM: full media. E2: 17ß estradiol treatment (100 nM). IL1ß: interleukin 1ß treatment (10 ng/mL). EGF: epidermal growth factor treatment (100 ng/mL). Results are from 3-6 independent replicates.
Figure 6
Figure 6. Effect of 3’ or 5’ agRNAs on recruitment of AGO2 protein to the 3’ or 5’ noncoding transcripts at the PR locus
RNA immunoprecipitation (RIP) of 3’ noncoding RNA using an anti-AGO2 antibody after treatment with (a) inhibitory RNA PR13580 in T47D cells or (b) activating RNA PR13515 in MCF7 cells on recruitment of AGO2 protein to the 3’ noncoding transcript. Effect of adding (c) inhibitory RNA PR-9 to T47D cells or (d) activating RNA PR-11 to MCF7 cells on recruitment of AGO2 protein to the 5’ noncoding transcript. Effect of adding (e) inhibitory RNA PR13580 to T47D cells or (f) activating RNA PR13515 to MCF7 cells on co-immunoprecipitation of AGO2 protein with the 5’ noncoding transcript. Effect of adding (g) inhibitory RNA PR-9 to T47D cells or (h) activating RNA PR-11 to MCF7 cells on co-immunoprecipitation of AGO2 protein with the 3’ noncoding transcript. The scheme above each gel depicts PR mRNA, the 3’ and/or 5’ noncoding transcripts, and AGO2 bound agRNA. The heaviest line represents the transcript being amplified. Duplex RNAs were added to cells at 25 nM. Experiments are representative of two independent determinations.
Figure 7
Figure 7. 3C analysis of the PR locus
(a) Schematic of the PR gene showing DpnII cleavage sites, exon boundaries, and locations of primers used for 3C analysis. The primer pairs used for 3C amplification are shown on the x axes of parts (b) and (d). (b) Top, qPCR showing the relative levels of detection of crosslinked product after treatment with a mismatch-containing RNA duplex or inhibitory duplexes PR-9 or PR13580. (c) qPCR showing reduced RNA levels in samples used for part (d). (d) Top, qPCR showing the relative levels of crosslinked product after treatment with a mismatch-containing RNA duplex or activating duplexes PR-11 or PR13515. (e) qPCR showing increased RNA levels in the samples used for part (d). Primer P amplifies a sequence at the PR promoter. Primers E1, E2, E3, and E4 amplify sequences within PR exons 1-4. Primers T1 and T2 amplify sequences beyond the terminus of PR mRNA. F1/F2= Fixed fragment. The fixed fragment is a normalization control derived from genomic DNA by primers complementary to sequences within exon 1. The bar represents performance of the normalization control, not its absolute value. Values in parts (b) and (d) are relative to amplification of sequence at the PR promoter using primer P. Duplex RNAs were added to cells at 25 nM. Two bands are observed in the T2/F2 analysis because of an alternative DpnII cleavage site. The positive control shows amplification of a synthetic DNA. Data are from three independent experiments.
Figure 8
Figure 8. Inhibition of PR expression by a miRNA complementary to the PR 3’ noncoding RNA
(a) Sequences for five computational matches between miRNAs and the region of PR 3’ noncoding RNA beyond +13,037 (Supplementary Fig. S27). Potential seed sequence matches (bases 2-8) are in boldface and underlined. (b) qPCR using four different primer sets showing the effects of adding miRNA mimics on PR expression. (c) Western analysis showing the effects of adding miRNA mimics on PR protein expression. (d) Dose response analysis showing effects of inhibitory miRNA miR-193b. (e) Western analysis showing inhibition of PR expression by MiR-193b and mismatch-containing analogs. (f) qPCR comparing the effects of inhibitor agRNA PR13580 or miR-193b on levels of the 5’ noncoding transcript, PR mRNA, PR pre-mRNA, and the 3’ noncoding transcript. (g) ChIP showing the effect of addition of miR-193b or inhibitory agRNA PR13580 on the presence of RNAP2 at the PR promoter. Experiments were performed in T47D cells. ***p<0.005, **p<0.01, and *p<0.05 as compared to cells treated with RNA MM. p-values were calculated using the two-tailed unpaired Student's T-test with equal variances. All error bars represent standard deviation. Duplex RNAs were added at 25 nM unless otherwise noted. Data are from triplicate independent experiments.
Figure 9
Figure 9. Model for modulation of transcription by 3’-agRNAs
(a) 100,000 bases separates the genomic locations of the promoter and 3’ terminal regions of the PR gene. Gene looping juxtaposes the 5’ promoter and 3’ terminator, bringing DNA sequences into close proximity. Addition of the 3’ agRNA recruits AGO2 to the 3’ noncoding transcript. The arrival of AGO2 may affect other proteins (here shown as unlabeled circles) at the gene promoter and alter regulation of transcription. The proximity of 3’ and 5’ noncoding transcripts allows them to co-immunoprecipitate during RIP with anti-AGO antibodies.

References

    1. Siomi H, Siomi MC. On the road to reading the RNA-interference code. Nature. 2009;457:396–404. - PubMed
    1. Morris KV, Chan SW, Jacobsen SE, Looney DJ. Small interfering RNA-induced transcriptional gene silencing in human cells. Science. 2004;305:1289–92. - PubMed
    1. Ting AH, Schuebel KE, Herman JG, Baylin SB. Short double-stranded RNA induces transcriptional gene silencing in human cancer cells in the absence of DNA methylation. Nat. Gen. 2005;37:906–910. - PMC - PubMed
    1. Janowski BA, et al. Inhibiting gene expression at transcription start sites in chromosomal DNA by antigene RNAs. Nat. Chem. Biol. 2005;1:216–222. - PubMed
    1. Li LC, et al. Small dsRNAs induce transcriptional activation in human cells. Proc. Natl. Acad. Sci. USA. 2006;103:17337–17342. - PMC - PubMed

Publication types

MeSH terms