Review
. 2010 Jul-Aug;2(4):489-506.
doi: 10.1002/wsbm.76.

Image-based models of cardiac structure in health and disease

Affiliations
Review

Image-based models of cardiac structure in health and disease

Fijoy Vadakkumpadan et al. Wiley Interdiscip Rev Syst Biol Med. 2010 Jul-Aug.

Abstract

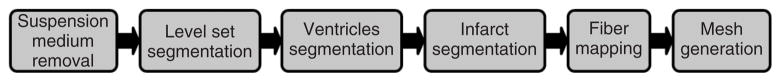
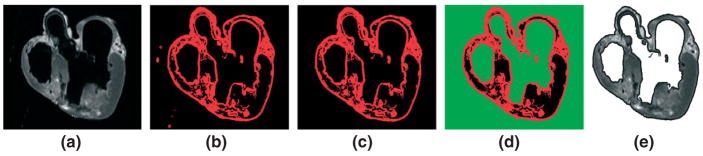
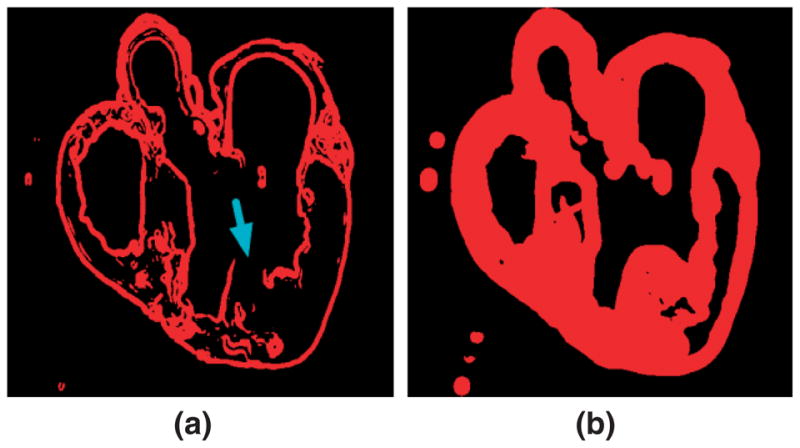
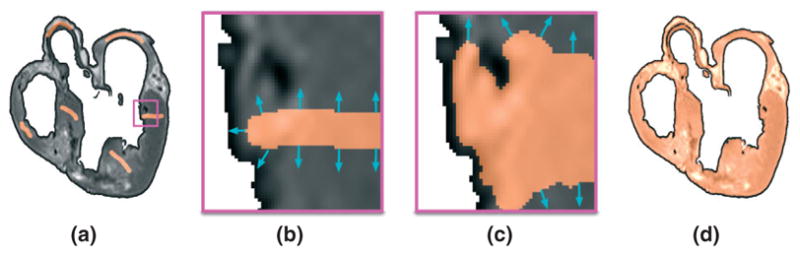
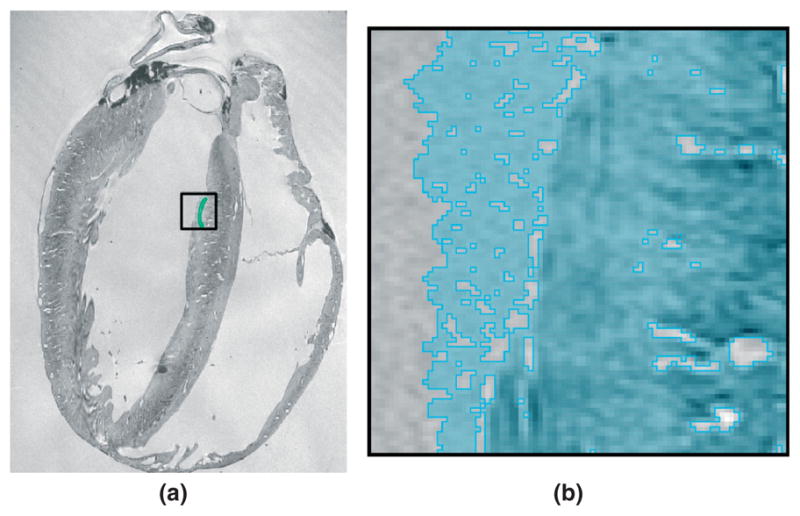
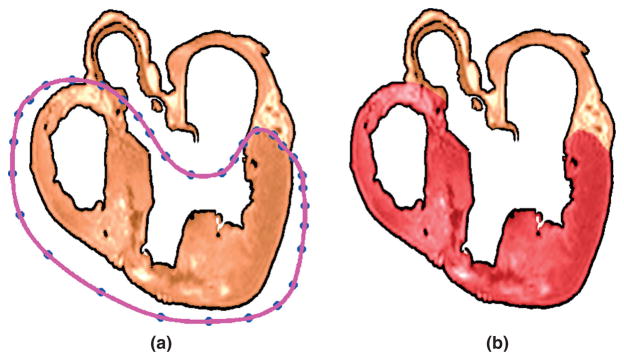
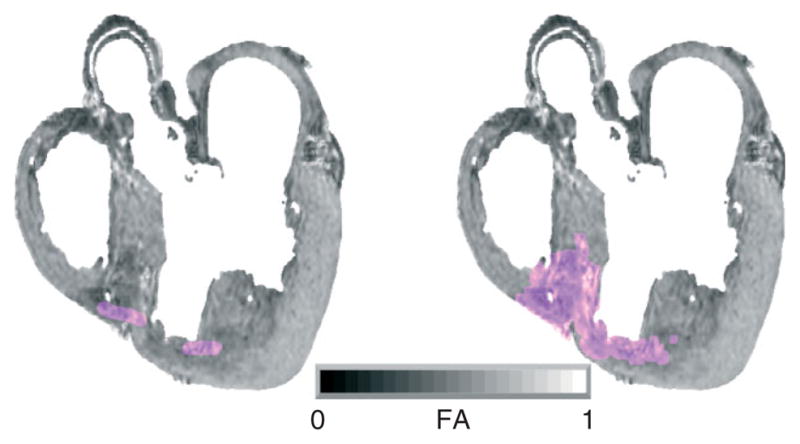
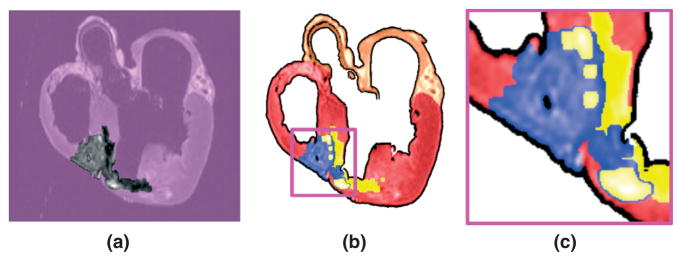
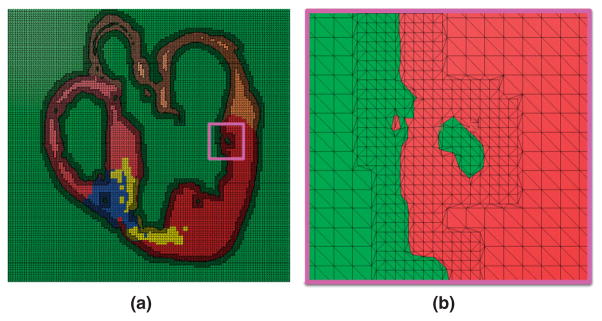
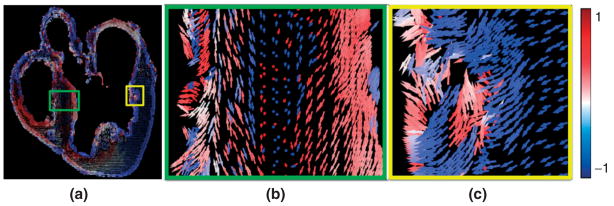
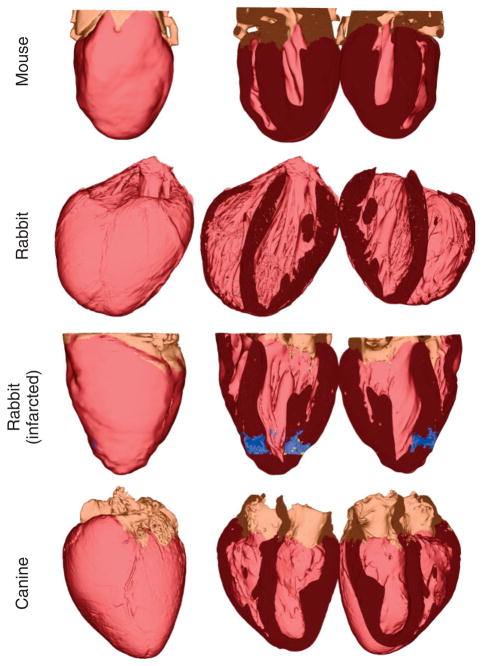
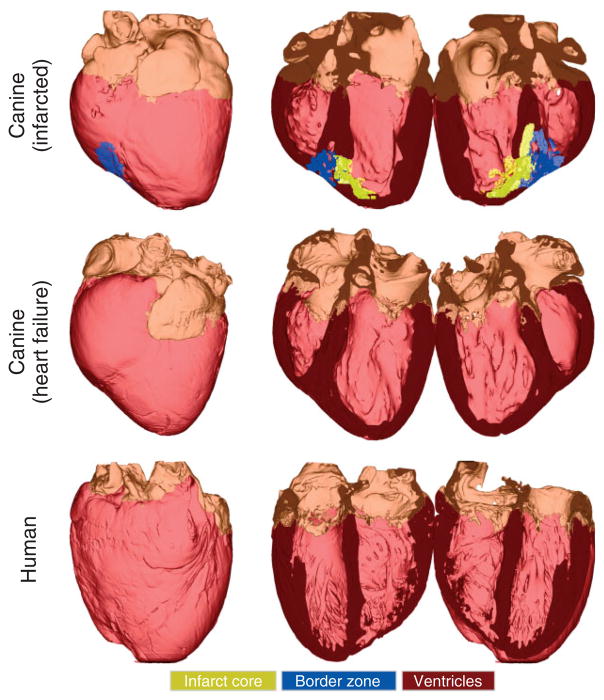
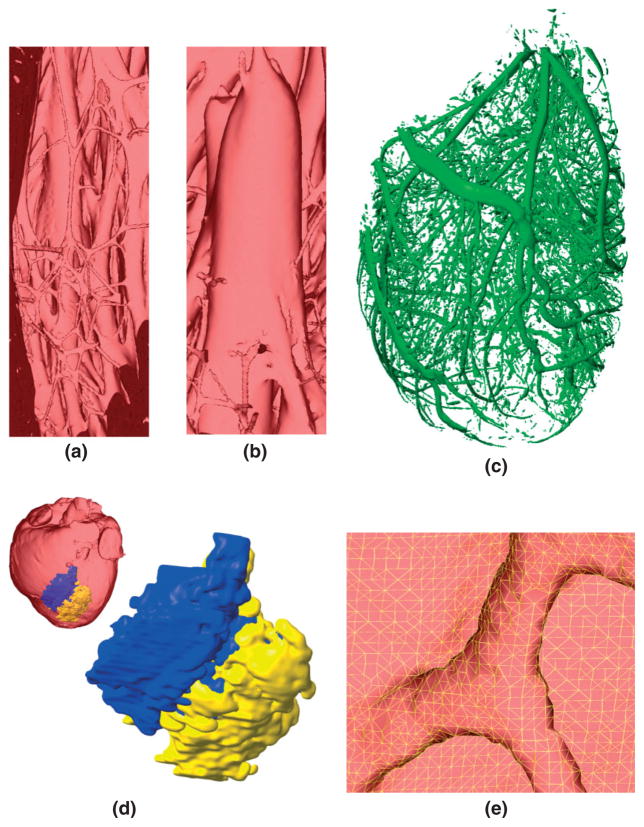
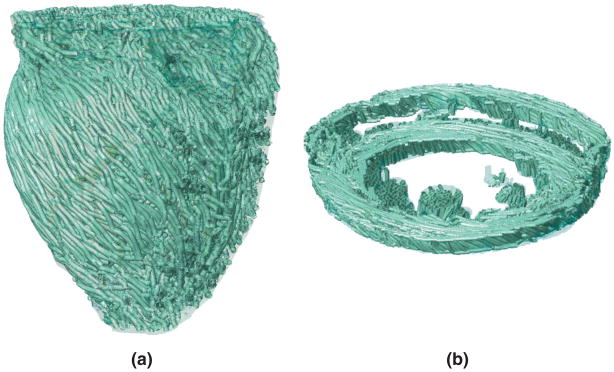
Computational approaches to investigating the electromechanics of healthy and diseased hearts are becoming essential for the comprehensive understanding of cardiac function. In this article, we first present a brief review of existing image-based computational models of cardiac structure. We then provide a detailed explanation of a processing pipeline which we have recently developed for constructing realistic computational models of the heart from high resolution structural and diffusion tensor (DT) magnetic resonance (MR) images acquired ex vivo. The presentation of the pipeline incorporates a review of the methodologies that can be used to reconstruct models of cardiac structure. In this pipeline, the structural image is segmented to reconstruct the ventricles, normal myocardium, and infarct. A finite element mesh is generated from the segmented structural image, and fiber orientations are assigned to the elements based on DTMR data. The methods were applied to construct seven different models of healthy and diseased hearts. These models contain millions of elements, with spatial resolutions in the order of hundreds of microns, providing unprecedented detail in the representation of cardiac structure for simulation studies.


Figures

FIGURE 1
FIGURE 1
The pipeline for model generation.
FIGURE 2
FIGURE 2
The suspension and cavity medium are removed using edge detection and region growing: (a) original slice; (b) detected edges in red; (c) myocardial boundary; (d) suspension and cavity medium in green; (e) original slice after removal of the medium.
FIGURE 3
FIGURE 3
The effect of variance threshold and local neighborhood radius on edge detection: (a) edges detected using a radius value of 2 pixels and a threshold value of 50; (b) edges detected using a radius value of 10 pixels and a threshold value of 26.
FIGURE 4
FIGURE 4
A detailed segmentation of the ventricular myocardium is obtained using a level set method: (a) user initialization of the level set segmentation; (b), (c) enlarged views of the evolution of the surface near the gap between endocardium and trabeculation in the region enclosed by the magenta box in (a); (d) final segmentation.
FIGURE 5
FIGURE 5
The leaking effect in level set segmentation in the image regions where the boundary between the myocardium and the suspension medium is blurred: (a) user initialization of the level set segmentation; (b) evolution of the surface into the suspension medium in the region enclosed by the black box in (a).
FIGURE 6
FIGURE 6
The ventricular myocardium is segmented by fitting splines through semi-automatically identified landmarks: (a) landmarks and spline for the processed slice shown in Figure 4(d); (b) segmented ventricular tissue highlighted in dark red.
FIGURE 7
FIGURE 7
The infarct region is separated from the normal myocardium by applying a level set segmentation to the 3D fractional anisotropy (FA) image: (a) user initialization of infarct segmentation for the original FA slice; (b) segmented infarct.
FIGURE 8
FIGURE 8
The infarct region is subdivided into two areas, core and border zone, by thresholding the structural magnetic resonance (MR) image based on the intensity values: (a) the infarct region of the slice shown in Figure 2(a); (b) the core (yellow) and border zone (blue) superimposed on the pre-processed slice shown in Figure 6(b); (c) enlarged view of the small region enclosed by the magenta box in (b).
FIGURE 9
FIGURE 9
Mesh generation: (a) mesh corresponding to the slice shown in Figure 8(b); (b) enlarged view of the small region enclosed by the magenta box in (a).
FIGURE 10
FIGURE 10
Assignment of fiber orientations: (a) 2D projection, on the xz plane, of orientations assigned to the mesh shown in Figure 9(a); (b) enlarged view of the small region enclosed by the green box in (a); (c) enlarged view of the small region enclosed by the yellow box in (a).
FIGURE 11
FIGURE 11
The generated models for normal mouse, normal rabbit, infarcted rabbit, and normal canine hearts. In each row, the first column shows the anterior view of the entire model, and the second and third columns show the model split in half along a horizontal long axis view plane.
FIGURE 12
FIGURE 12
The generated models for infarcted canine, canine with heart failure, and normal human hearts. In each row, the first column shows the anterior view of the entire model, and the second and third columns show the model split in half along a horizontal long axis view plane.
FIGURE 13
FIGURE 13
Demonstration of the structural detail that can be obtained using our processing pipeline: (a) the endocardial trabeculations in the apical region of the left ventricle in the normal rabbit model; (b) a papillary muscle that is attached to the mitral valve of the normal rabbit model; (c) blood vessels and interlaminar clefts in the normal rabbit model; (d) 3D view of the infarct in the canine model; (e) enlarged view of the mesh near the insertion point of a trabeculation in the apical region of the normal rabbit model.
FIGURE 14
FIGURE 14
Visualization of fiber tracks, indicative of regionally prevailing cell orientation, in the infarcted rabbit model: (a) epicardial view of tracks in the entire model; (b) tracks in a slab of tissue between two short axes planes.

Similar articles

Cited by

References

    1. Rodgers A, Vaughan P. The World Health Report 2002. Geneva, Switzerland: The World Health Organization; 2002.
    1. Noble D. Modeling the heart–from genes to cells to the whole organ. Science. 2002;295:1678–1682. - PubMed
    1. Plank G, Burton RAB, Hales P, Bishop M, Mansoori T, et al. Generation of histo-anatomically representative models of the individual heart: tools and application. Philos Trans R Soc A. 2009;367:2257–2292. - PMC - PubMed
    1. Hunter PJ, Pullan AJ, Smaill BH. Modeling total heart function. Ann Rev Biomed Eng. 2003;5:147–177. - PubMed
    1. Trayanova N, Eason J, Aguel F. Computer simulations of cardiac defibrillation: a look inside the heart. Comput Vis in Sci. 2002;4:259–270.

Publication types