

Metallomic profiling and linkage map analysis of early Parkinson's disease: a new insight to aluminum marker for the possible diagnosis
- PMID: 20582167
- PMCID: PMC2889819
- DOI: 10.1371/journal.pone.0011252
Metallomic profiling and linkage map analysis of early Parkinson's disease: a new insight to aluminum marker for the possible diagnosis
Abstract
Background: Parkinson's disease (PD) is the most common neurodegenerative disorder. The diagnosis of PD is challenging and currently none of the biochemical tests have proven to help in diagnosis. Serum metallomic analysis may suggest the possibility of diagnosis of PD.
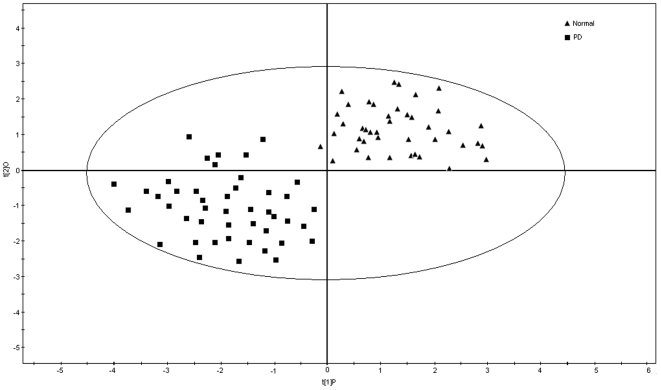
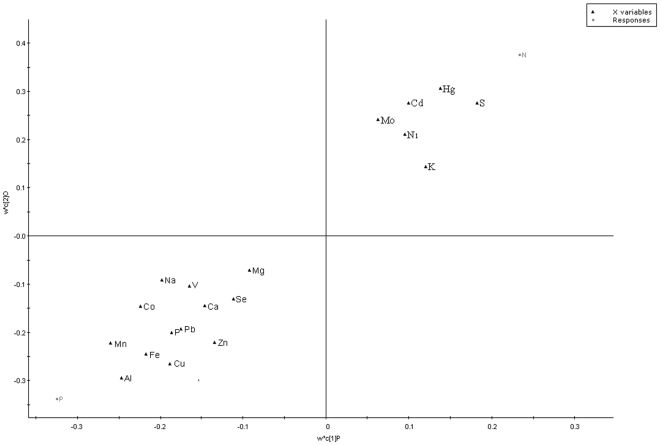
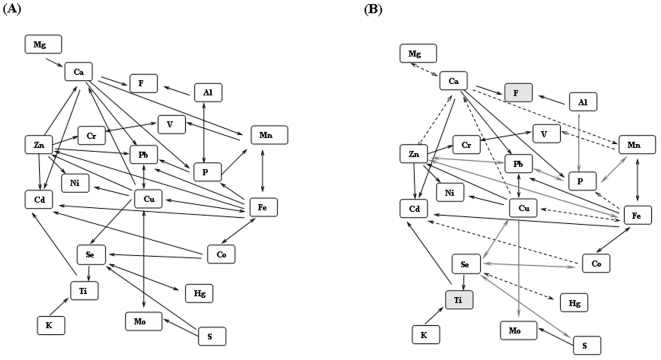
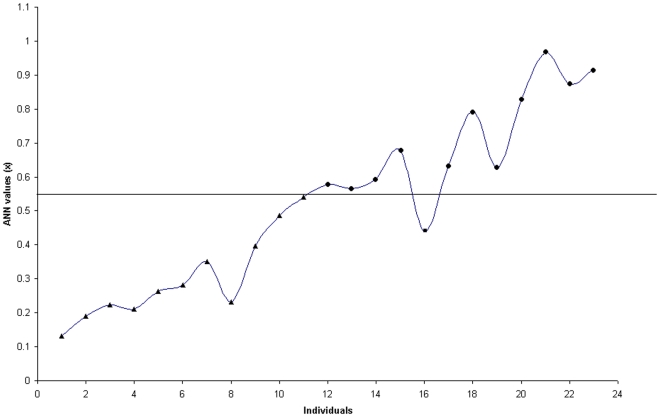
Methodology/results: The metallomic analysis was targeted on 31 elements obtained from 42 healthy controls and 45 drug naive PD patients using ICP-AES and ICP-MS to determine the concentration variations of elements between PD and normal. The targeted metallomic analysis showed the significant variations in 19 elements of patients compared to healthy control (p<0.04). The partial least squares discriminant analysis (PLS-DA) showed aluminium, copper, iron, manganese and zinc are the key elements, contributes the separation of PD patients from control samples. The correlation coefficient analysis and element-element ratio confirm the imbalance of inter-elements relationship in PD patients' serum. Furthermore, elements linkage map analysis showed aluminium is a key element involved in triggering of phosphorus, which subsequently lead to imbalance of homeostatic in PD serum. The execution of neural network using elements concentrations provides 95% accuracy in detection of disease.
Conclusions/significance: These results suggest that there is a disturbance in the elements homeostasis and inter-elements relationship in PD patients' serum. The analysis of serum elements helps in linking the underlying cellular processes such as oxidative stress, neuronal dysfunction and apoptosis, which are the dominating factors in PD. Also, these results increase the prospect of detection of early PD from serum through neural network algorithm.
Conflict of interest statement
Figures
Similar articles
-
Metallomic Biomarkers in Cerebrospinal fluid and Serum in patients with Parkinson's disease in Indian population.Sci Rep. 2016 Oct 18;6:35097. doi: 10.1038/srep35097. Sci Rep. 2016. PMID: 27752066 Free PMC article.
-
Metabolic profiling of Parkinson's disease: evidence of biomarker from gene expression analysis and rapid neural network detection.J Biomed Sci. 2009 Jul 13;16(1):63. doi: 10.1186/1423-0127-16-63. J Biomed Sci. 2009. PMID: 19594911 Free PMC article.
-
TRNA-derived fragments as sex-dependent circulating candidate biomarkers for Parkinson's disease.Parkinsonism Relat Disord. 2019 Aug;65:203-209. doi: 10.1016/j.parkreldis.2019.05.035. Epub 2019 May 25. Parkinsonism Relat Disord. 2019. PMID: 31402278
-
Selenium and Other Trace Elements in the Etiology of Parkinson's Disease: A Systematic Review and Meta-Analysis of Case-Control Studies.Neuroepidemiology. 2020;54(1):1-23. doi: 10.1159/000502357. Epub 2019 Aug 27. Neuroepidemiology. 2020. PMID: 31454800
-
New markers in Parkinson's disease.Adv Clin Chem. 2020;96:137-178. doi: 10.1016/bs.acc.2019.12.001. Epub 2020 Jan 2. Adv Clin Chem. 2020. PMID: 32362317 Review.
Cited by
-
Metallomic Biomarkers in Cerebrospinal fluid and Serum in patients with Parkinson's disease in Indian population.Sci Rep. 2016 Oct 18;6:35097. doi: 10.1038/srep35097. Sci Rep. 2016. PMID: 27752066 Free PMC article.
-
Iron Status May Not Affect Amyotrophic Lateral Sclerosis: A Mendelian Randomization Study.Front Genet. 2021 Mar 4;12:617245. doi: 10.3389/fgene.2021.617245. eCollection 2021. Front Genet. 2021. PMID: 33747043 Free PMC article.
-
Microglial Activation in Metal Neurotoxicity: Impact in Neurodegenerative Diseases.Biomed Res Int. 2023 Jan 31;2023:7389508. doi: 10.1155/2023/7389508. eCollection 2023. Biomed Res Int. 2023. PMID: 36760476 Free PMC article. Review.
-
Bioinorganic Chemistry of Micronutrients Related to Alzheimer's and Parkinson's Diseases.Molecules. 2023 Jul 17;28(14):5467. doi: 10.3390/molecules28145467. Molecules. 2023. PMID: 37513339 Free PMC article. Review.
-
Attenuation of Aluminum Chloride-Induced Neuroinflammation and Caspase Activation Through the AKT/GSK-3β Pathway by Hesperidin in Wistar Rats.Neurotox Res. 2018 Oct;34(3):463-476. doi: 10.1007/s12640-018-9904-4. Epub 2018 Apr 23. Neurotox Res. 2018. PMID: 29687202
References
-
- Ahmed SSSJ, Santosh W, Kumar S. Vib. Spectrosc In press; 2009. Neural network algorithm for the early detection of Parkinson's disease from blood plasma by FTIR micro-spectroscopy.
-
- Gelb, Oliver, Gilman Diagnostic criteria for Parkinson disease. Arch Neurol. 1999;56:33–39. - PubMed
Publication types
MeSH terms
Substances
LinkOut - more resources
Full Text Sources
Medical
