

Scientometric analysis and combined density-equalizing mapping of environmental tobacco smoke (ETS) research
- PMID: 20582305
- PMCID: PMC2889821
- DOI: 10.1371/journal.pone.0011254
Scientometric analysis and combined density-equalizing mapping of environmental tobacco smoke (ETS) research
Abstract
Background: Passive exposure to environmental tobacco smoke (ETS) is estimated to exert a major burden of disease. Currently, numerous countries have taken legal actions to protect the population against ETS. Numerous studies have been conducted in this field. Therefore, scientometric methods should be used to analyze the accumulated data since there is no such approach available so far.
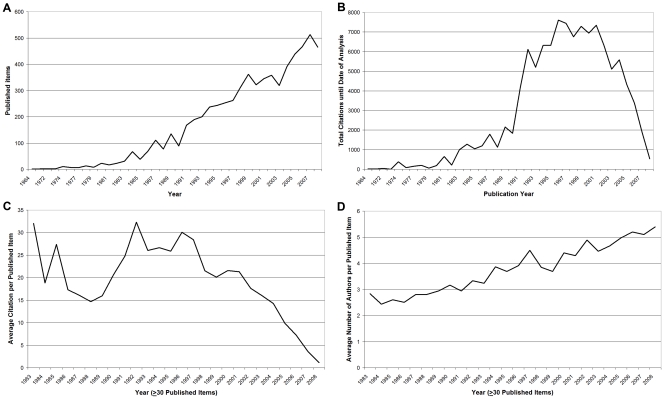
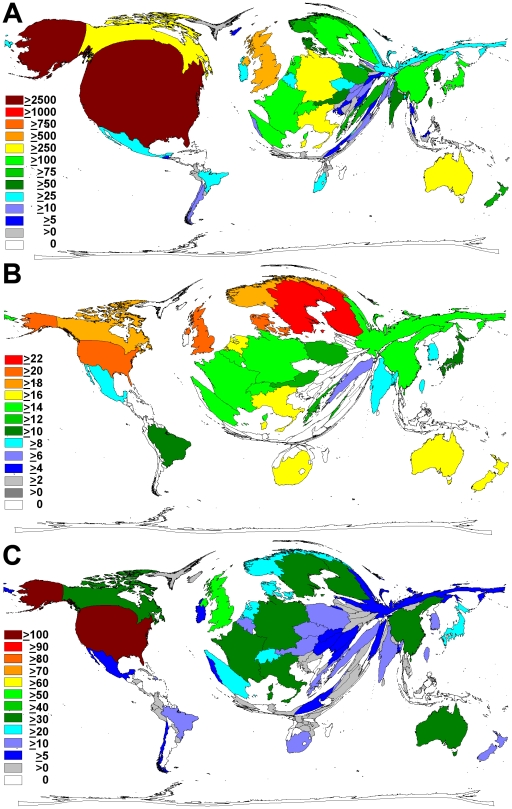
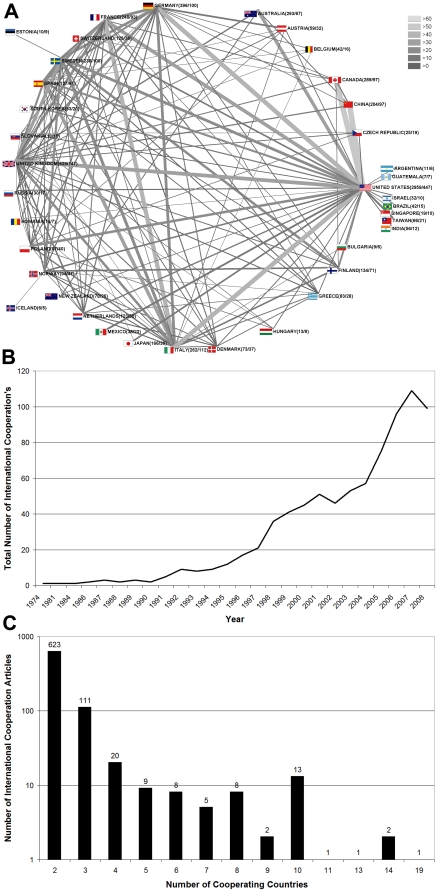
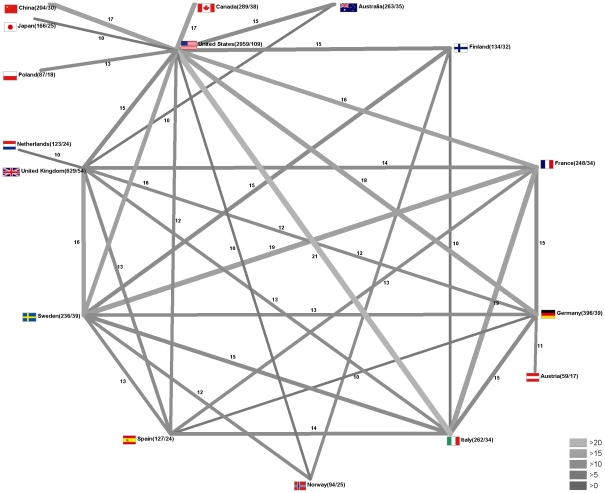
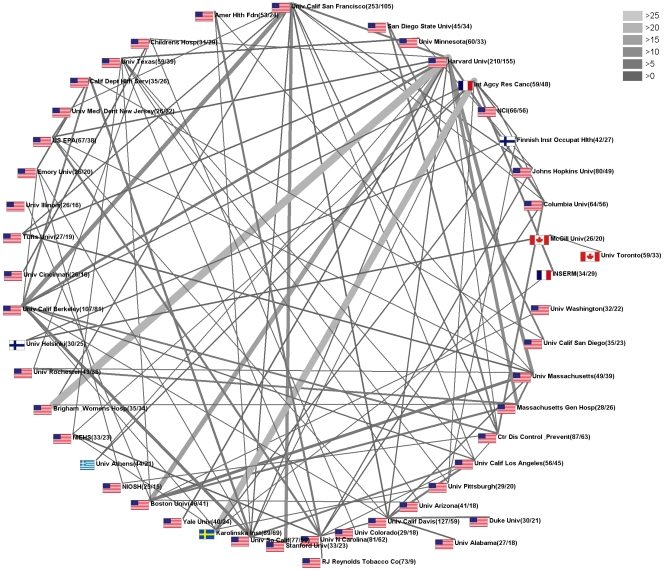
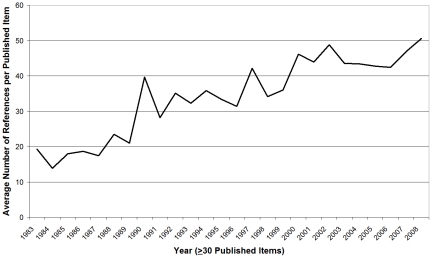
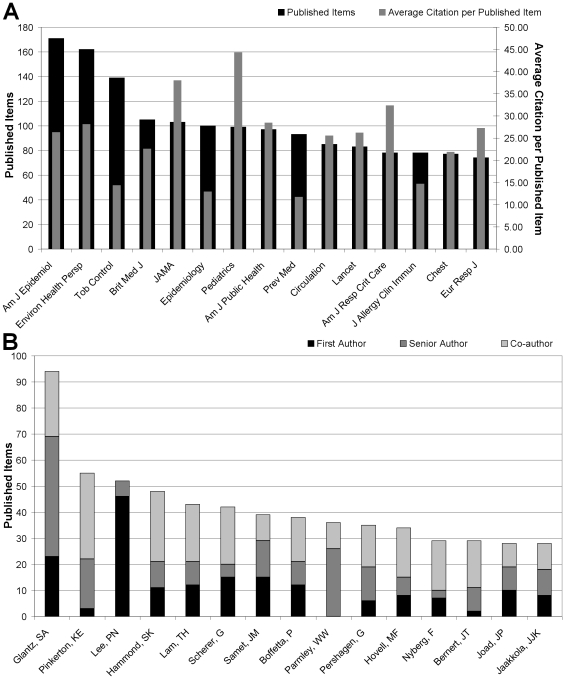
Methods and results: A combination of scientometric methods and novel visualizing procedures were used, including density-equalizing mapping and radar charting techniques. 6,580 ETS-related studies published between 1900 and 2008 were identified in the ISI database. Using different scientometric approaches, a continuous increase of both quantitative and qualitative parameters was found. The combination with density-equalizing calculations demonstrated a leading position of the United States (2,959 items published) in terms of quantitative research activities. Charting techniques demonstrated that there are numerous bi- and multilateral networks between different countries and institutions in this field. Again, a leading position of American institutions was found.
Conclusions: This is the first comprehensive scientometric analysis of data on global scientific activities in the field of environmental tobacco smoke research. The present findings can be used as a benchmark for funding allocation processes.
Conflict of interest statement
Figures
Similar articles
-
Tobacco control: visualisation of research activity using density-equalizing mapping and scientometric benchmarking procedures.Int J Environ Res Public Health. 2009 Jun;6(6):1856-69. doi: 10.3390/ijerph6061856. Epub 2009 Jun 12. Int J Environ Res Public Health. 2009. PMID: 19578464 Free PMC article.
-
Density-equalizing mapping and scientometric benchmarking in Industrial Health.Ind Health. 2010;48(2):197-203. doi: 10.2486/indhealth.48.197. Ind Health. 2010. PMID: 20424350
-
Drowning--a scientometric analysis and data acquisition of a constant global problem employing density equalizing mapping and scientometric benchmarking procedures.Int J Health Geogr. 2011 Oct 14;10:55. doi: 10.1186/1476-072X-10-55. Int J Health Geogr. 2011. PMID: 21999813 Free PMC article.
-
[A scientometric analysis of leukoplakia and erythroplakia].Laryngorhinootologie. 2010 Apr;89(4):210-5. doi: 10.1055/s-0029-1243624. Epub 2010 Apr 12. Laryngorhinootologie. 2010. PMID: 20387174 Review. German.
-
Global architecture of gestational diabetes research: density-equalizing mapping studies and gender analysis.Nutr J. 2016 Apr 4;15:36. doi: 10.1186/s12937-016-0154-0. Nutr J. 2016. PMID: 27044432 Free PMC article. Review.
Cited by
-
Ovarian cancer: density equalizing mapping of the global research architecture.Int J Health Geogr. 2017 Jan 13;16(1):3. doi: 10.1186/s12942-016-0076-2. Int J Health Geogr. 2017. PMID: 28086974 Free PMC article.
-
Nanoparticles and cars - analysis of potential sources.J Occup Med Toxicol. 2012 Jun 22;7(1):13. doi: 10.1186/1745-6673-7-13. J Occup Med Toxicol. 2012. PMID: 22726351 Free PMC article.
-
Mapping of zebrafish research: a global outlook.Zebrafish. 2013 Dec;10(4):510-7. doi: 10.1089/zeb.2012.0854. Epub 2013 Oct 16. Zebrafish. 2013. PMID: 24131434 Free PMC article.
-
Bacterial meningitis: a density-equalizing mapping analysis of the global research architecture.Int J Environ Res Public Health. 2014 Sep 30;11(10):10202-14. doi: 10.3390/ijerph111010202. Int J Environ Res Public Health. 2014. PMID: 25272079 Free PMC article.
-
New quality and quantity indices in science (NewQIS): results of the first decade-project progress review.Scientometrics. 2019;121(1):451-478. doi: 10.1007/s11192-019-03188-8. Epub 2019 Jul 13. Scientometrics. 2019. PMID: 32214551 Free PMC article.
References
MeSH terms
Substances
LinkOut - more resources
Full Text Sources
