Comparative Study
. 2010 Jun 22;5(6):e11257.
doi: 10.1371/journal.pone.0011257.

Phylogenetic and evolutionary patterns in microbial carotenoid biosynthesis are revealed by comparative genomics

Affiliations
Comparative Study

Phylogenetic and evolutionary patterns in microbial carotenoid biosynthesis are revealed by comparative genomics

Jonathan L Klassen. PLoS One. .

Abstract

Background: Carotenoids are multifunctional, taxonomically widespread and biotechnologically important pigments. Their biosynthesis serves as a model system for understanding the evolution of secondary metabolism. Microbial carotenoid diversity and evolution has hitherto been analyzed primarily from structural and biosynthetic perspectives, with the few phylogenetic analyses of microbial carotenoid biosynthetic proteins using either used limited datasets or lacking methodological rigor. Given the recent accumulation of microbial genome sequences, a reappraisal of microbial carotenoid biosynthetic diversity and evolution from the perspective of comparative genomics is warranted to validate and complement models of microbial carotenoid diversity and evolution based upon structural and biosynthetic data.

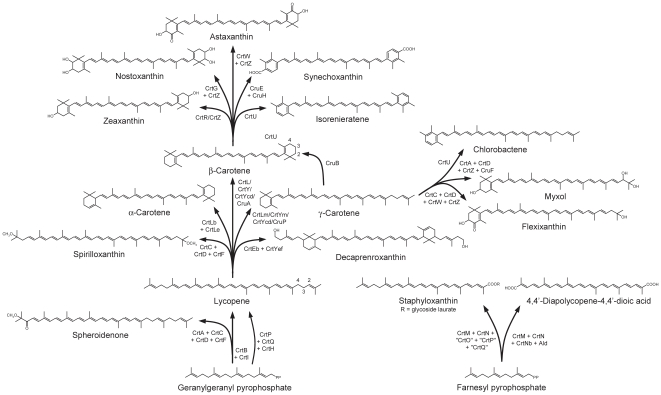
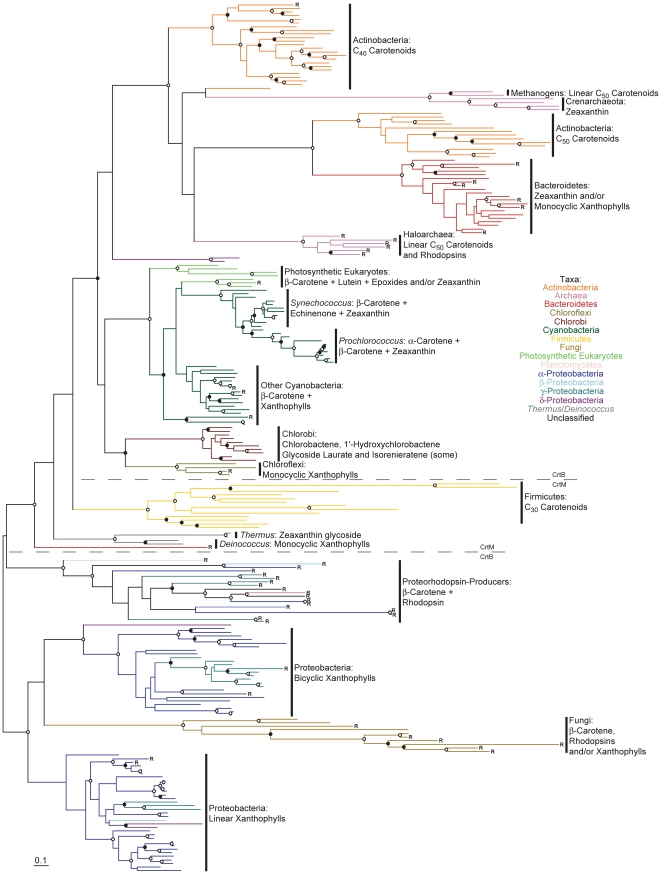
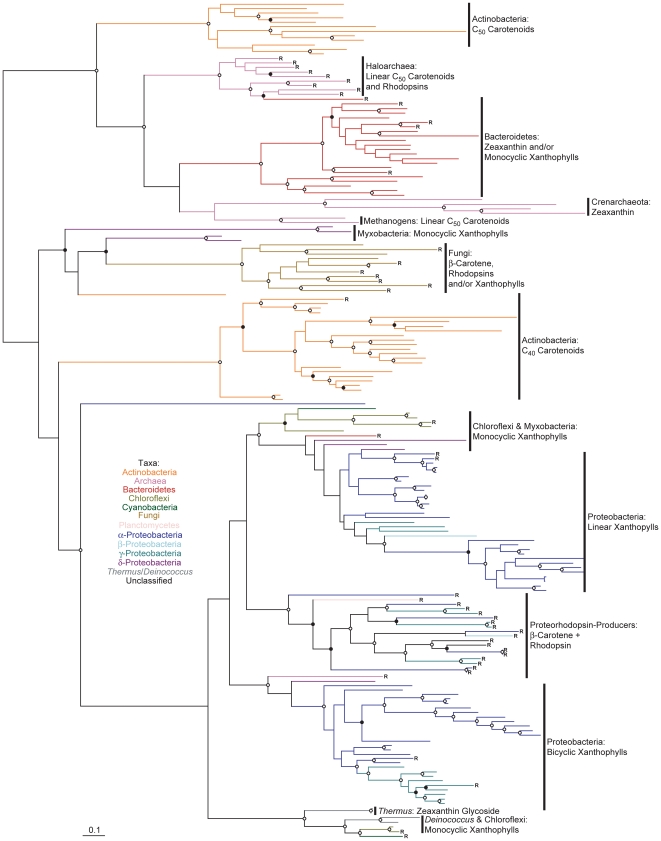
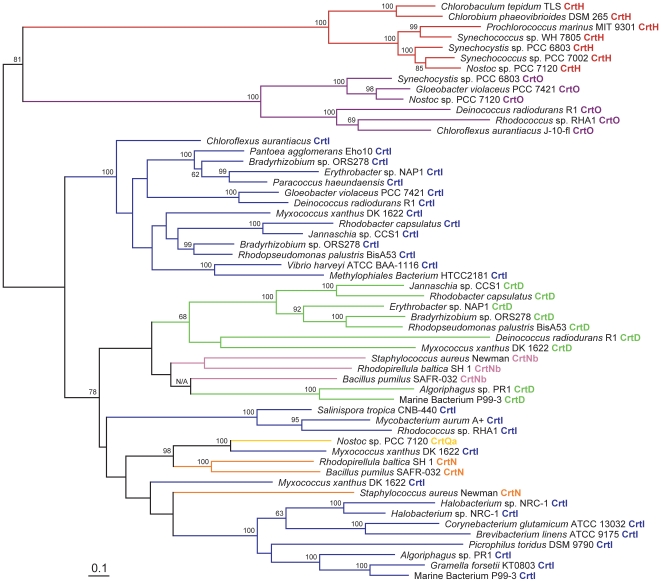
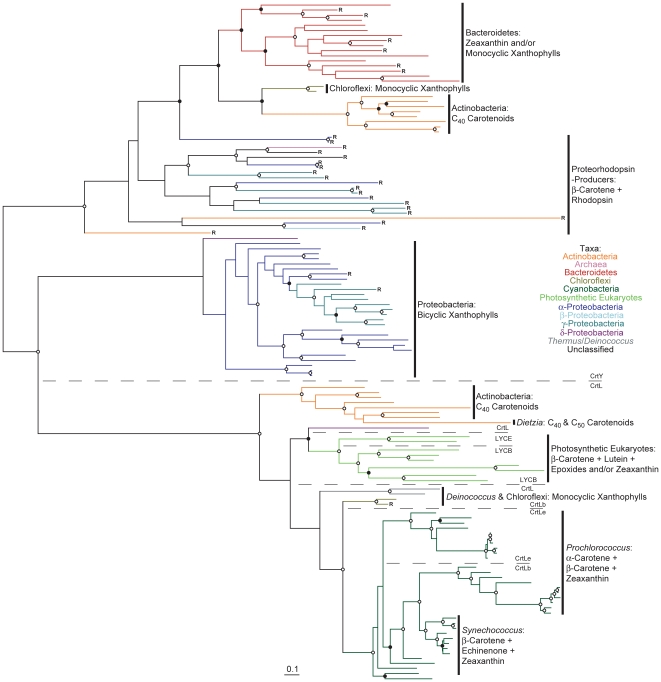
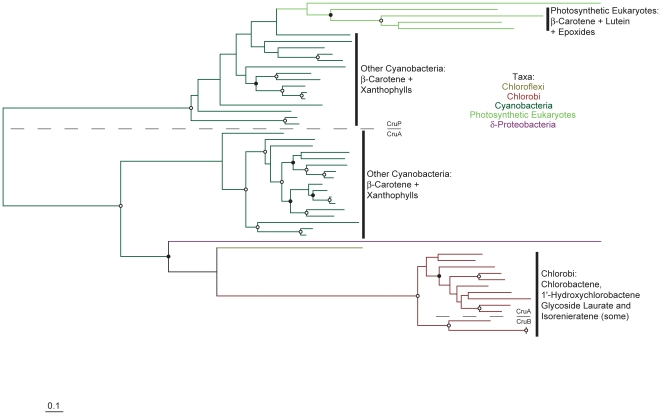
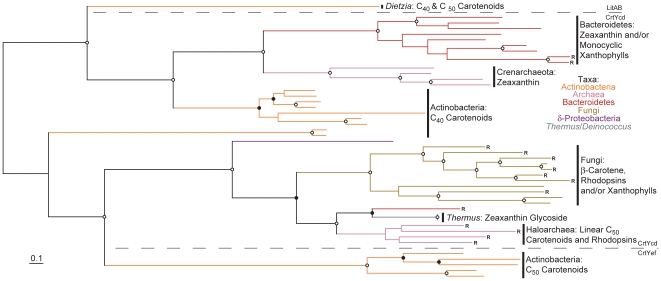
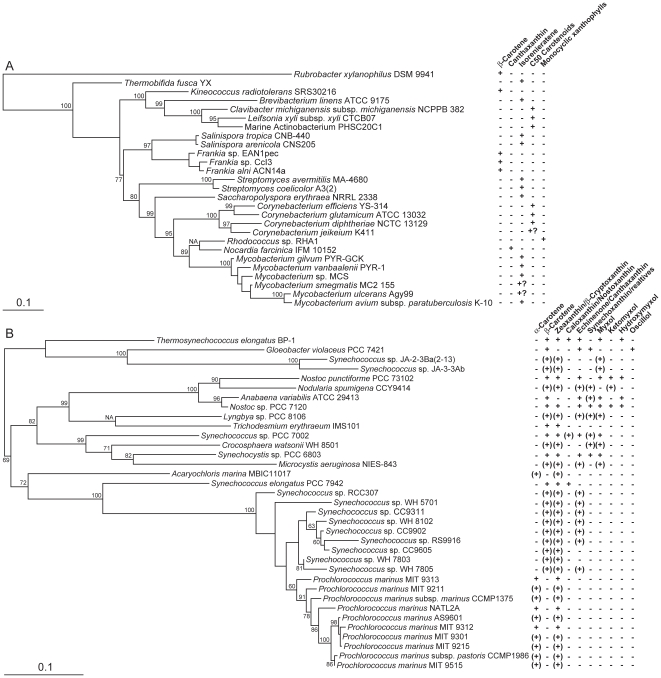
Methodology/principal findings: Comparative genomics were used to identify and analyze in silico microbial carotenoid biosynthetic pathways. Four major phylogenetic lineages of carotenoid biosynthesis are suggested composed of: (i) Proteobacteria; (ii) Firmicutes; (iii) Chlorobi, Cyanobacteria and photosynthetic eukaryotes; and (iv) Archaea, Bacteroidetes and two separate sub-lineages of Actinobacteria. Using this phylogenetic framework, specific evolutionary mechanisms are proposed for carotenoid desaturase CrtI-family enzymes and carotenoid cyclases. Several phylogenetic lineage-specific evolutionary mechanisms are also suggested, including: (i) horizontal gene transfer; (ii) gene acquisition followed by differential gene loss; (iii) co-evolution with other biochemical structures such as proteorhodopsins; and (iv) positive selection.

Conclusions/significance: Comparative genomics analyses of microbial carotenoid biosynthetic proteins indicate a much greater taxonomic diversity then that identified based on structural and biosynthetic data, and divides microbial carotenoid biosynthesis into several, well-supported phylogenetic lineages not evident previously. This phylogenetic framework is applicable to understanding the evolution of specific carotenoid biosynthetic proteins or the unique characteristics of carotenoid biosynthetic evolution in a specific phylogenetic lineage. Together, these analyses suggest a "bramble" model for microbial carotenoid biosynthesis whereby later biosynthetic steps exhibit greater evolutionary plasticity and reticulation compared to those closer to the biosynthetic "root". Structural diversification may be constrained ("trimmed") where selection is strong, but less so where selection is weaker. These analyses also highlight likely productive avenues for future research and bioprospecting by identifying both gaps in current knowledge and taxa which may particularly facilitate carotenoid diversification.


Conflict of interest statement

Competing Interests: The author has declared that no competing interests exist.

Figures

Figure 1
Figure 1. Known carotenoid biosynthetic pathways.
For simplicity, only representative carotenoids and major intermediates are shown. Functionally equivalent enzymes are indicated by a slash; for alternative names of homologous sequences see Table S3. Carbon numbers are indicated for lycopene and β-carotene.
Figure 2
Figure 2. Phylogenetic tree of CrtB and CrtM protein sequences constructed using RAxML.
Bootstrap values are indicated as a percentage of the automatically determined number of replicates determined using the CIPRES web portal; those ≥80% are indicated by an open circle and those ≥60% but <80% by a filled circle. For a version of this tree containing sequence names and numerical bootstrap values see Figure S1. Genomes containing a rhodopsin homolog are indicated by an “R”. Carotenoids typical of each lineage are indicated to the right of each clade; note that not all structures are included. The scale bar represents 10% sequence divergence. The tree is rooted to its midpoint to maximize the clarity of intraclade relationships.
Figure 3
Figure 3. Phylogenetic tree of CrtI protein sequences constructed using RAxML.
Bootstrap values are indicated as a percentage of the automatically determined number of replicates determined using the CIPRES web portal; those ≥80% are indicated by an open circle and those ≥60% but <80% by a filled circle. For a version of this tree containing sequence names and numerical bootstrap values see Figure S2. Genomes containing a rhodopsin homolog are indicated by an “R”. Carotenoids typical of each lineage are indicated to the right of each clade; note that not all structures are included. The scale bar represents 10% sequence divergence. The tree is rooted to its midpoint to maximize the clarity of intraclade relationships.
Figure 4
Figure 4. Phylogenetic tree of representative CrtD, CrtH, CrtI, CrtN, CrtNb, CrtO and CrtQa protein sequences constructed using RAxML.
Protein types are color-coded and indicated to the right of the sequence name. Bootstrap values ≥60% are indicated as a percentage of the automatically determined number of replicates determined using the CIPRES web portal. The scale bar represents 10% sequence divergence. The tree is rooted to its midpoint to maximize the clarity of intraclade relationships.
Figure 5
Figure 5. Phylogenetic tree of CrtL and CrtY protein sequences constructed using RAxML.
Bootstrap values are indicated as a percentage of the automatically determined number of replicates determined using the CIPRES web portal; those ≥80% are indicated by an open circle and those ≥60% but <80% by a filled circle. For a version of this tree containing sequence names and numerical bootstrap values see Figure S5. Genomes containing a rhodopsin homolog are indicated by an “R”. Carotenoids typical of each lineage are indicated to the right of each clade; note that not all structures are included. The scale bar represents 10% sequence divergence. The tree is rooted to its midpoint to maximize the clarity of intraclade relationships.
Figure 6
Figure 6. Phylogenetic tree of CruA, CruB and CruP protein sequences constructed using RAxML.
Bootstrap values are indicated as a percentage of the automatically determined number of replicates determined using the CIPRES web portal; those ≥80% are indicated by an open circle and those ≥60% but <80% by a filled circle. For a version of this tree containing sequence names and numerical bootstrap values see Figure S6. Genomes containing a rhodopsin homolog are indicated by an “R”. Carotenoids typical of each lineage are indicated to the right of each clade; note that not all structures are included. The scale bar represents 10% sequence divergence. The tree is rooted to its midpoint to maximize the clarity of intraclade relationships.
Figure 7
Figure 7. Phylogenetic tree of CrtYcd, CrtYef and LitAB protein sequences constructed using RAxML.
Fungal bifunctional proteins and LitBC have been trimmed (see Table S2) and, where applicable, individual CrtYc and CrtYd or CrtYe and CrtYf proteins fused to facilitate comparison of equivalent sequences. Bootstrap values are indicated as a percentage of the automatically determined number of replicates determined using the CIPRES web portal; those ≥80% are indicated by an open circle and those ≥60% but <80% by a filled circle. For a version of this tree containing sequence names and numerical bootstrap values see Figure S7. Genomes containing a rhodopsin homolog are indicated by an “R”. Carotenoids typical of each lineage are indicated to the right of each clade; note that not all structures are included. The scale bar represents 10% sequence divergence. The tree is rooted to its midpoint to maximize the clarity of intraclade relationships.
Figure 8
Figure 8. Phylogenetic trees constructed from nearly full-length 16S rRNA genes from carotenoid-producing members of (A) Actinobacteria and (B) Cyanobacteria constructed using RAxML.
Bootstrap values ≥60% are indicated as a percentage of the automatically determined number of replicates determined using the CIPRES web portal. All trees are rooted to their midpoint, and the scale bar represents 10% sequence divergence. NA indicates the ML basal node for which no bootstrap value was given. Question marks indicate organisms for which carotenoid biosynthetic pathways are incomplete, likely from genomic decay. For Cyanobacteria, known carotenoids are derived from the compilations of Maresca et al. and Takaichi and Mochimaru , with inferences derived from in silico pathway reconstructions (Table S1) indicated in brackets. For Actinobacteria, carotenoid pathway products are nearly exclusively derived from pathway reconstructions (Table S1) due to the lack of 16S rRNA genes for most biochemically studied strains. Note that for clarity, not all terminal pathway modifications (especially glycosylations) are indicated, and carotenoids similarly modified at each end are grouped together because of the difficulty in determining this level of substrate specificity via exclusively in silico analysis.
Figure 9
Figure 9. Distributions of pair-wise dn/ds values, rounded to one decimal place, for Synechococcus, bicyclic xanthophyll-producing γ-Proteobacteria, C40 Actinobacteria and myxobacteria, expressed as a percentage of the total number of comparisons (n) for each sequence cluster protein.
Only values with dn>0.01 and ds<1.5 were included; note that these cut-offs underestimate values at the lower range of the distributions shown, especially for Synechococcus. Results for other taxa are shown in Figure S14.

Similar articles

Cited by

References

    1. Britton G, Liaaen-Jensen S, Pfander H. Basal, Switzerland: Birkhäuser Verlag; 2004. Carotenoids handbook.
    1. Britton G. Structure and properties of carotenoids in relation to function. FASEB J. 1995;9:1551–1558. - PubMed
    1. Fraser NJ, Hashimoto H, Cogdell RJ. Carotenoids and bacterial photosynthesis: the story so far. Photosynth Res. 2001;70:249–256. - PubMed
    1. Frank HA, Brudvig GW. Redox functions of carotenoids in photosynthesis. Biochemistry. 2004;43:8607–8615. - PubMed
    1. Frank HA, Cogdell RJ. Carotenoids in photosynthesis. Photochem Photobiol. 1996;63:257–264. - PubMed

Publication types

LinkOut - more resources