

Factor binding and chromatin modification in the promoter of murine Egr1 gene upon induction
- PMID: 20582451
- PMCID: PMC11115556
- DOI: 10.1007/s00018-010-0426-3
Factor binding and chromatin modification in the promoter of murine Egr1 gene upon induction
Abstract
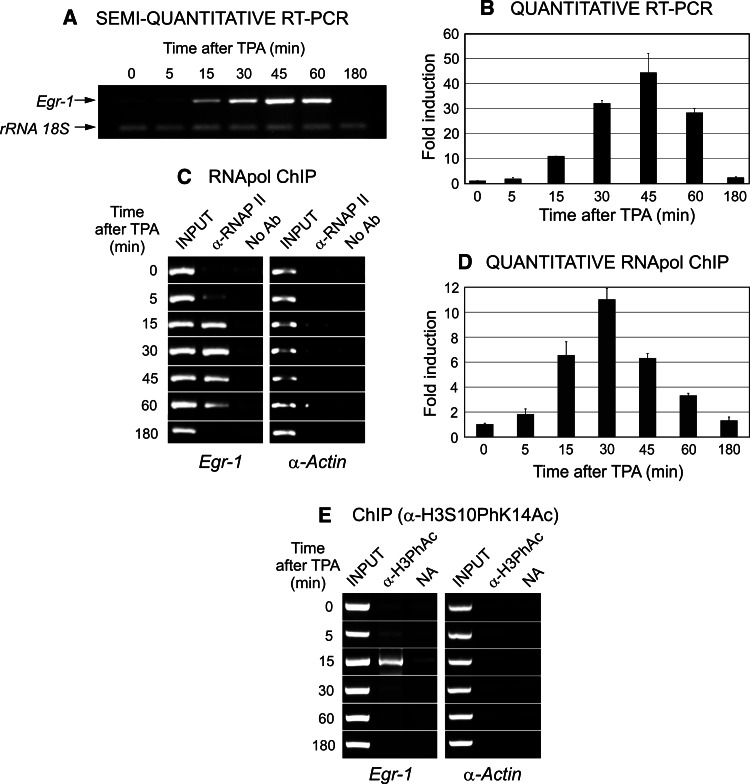
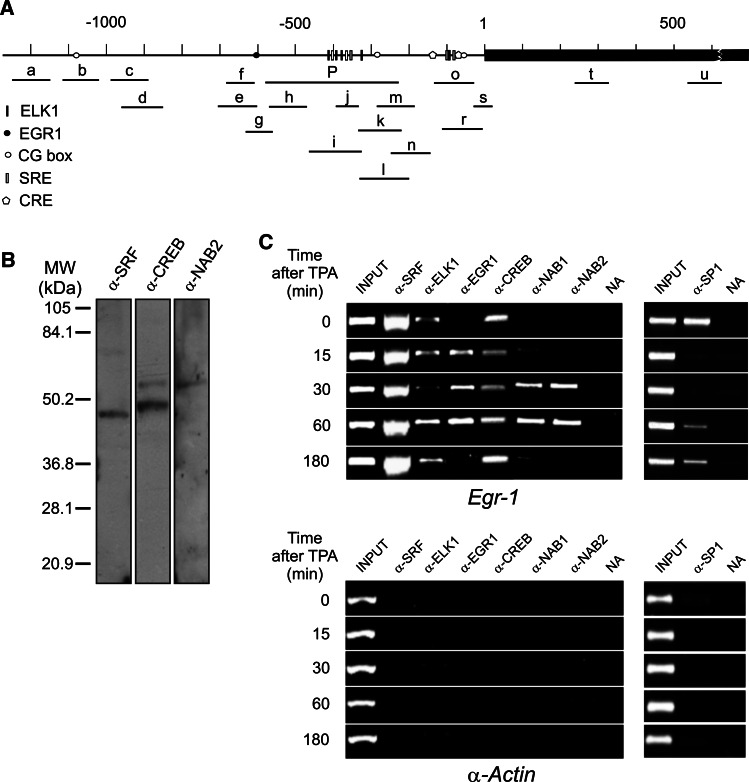
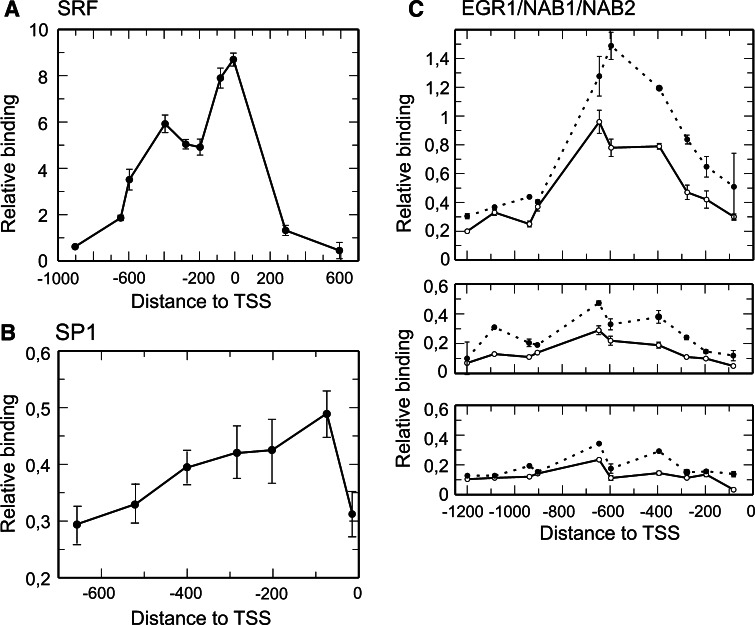
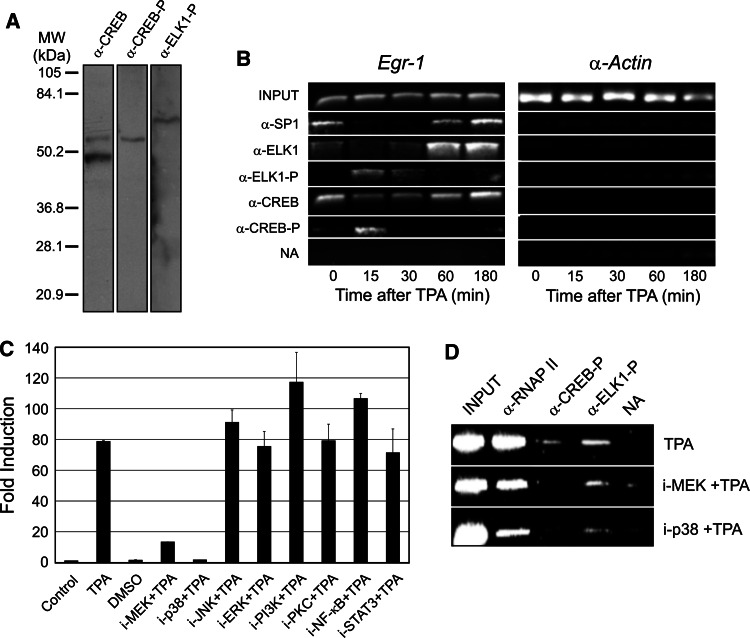
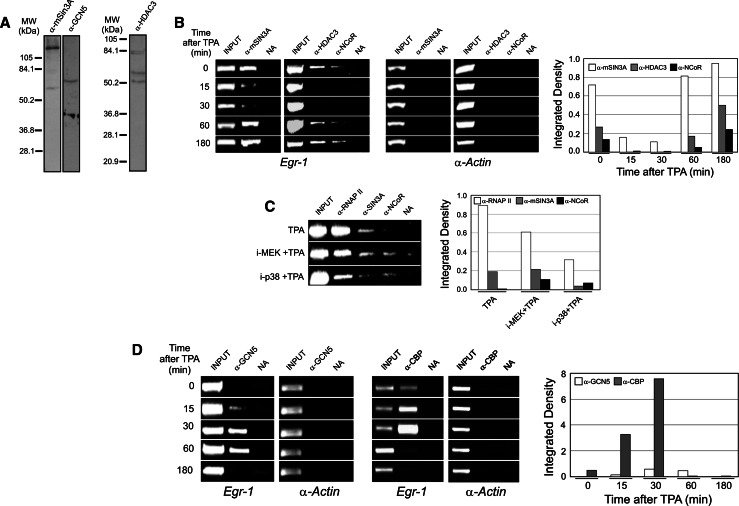
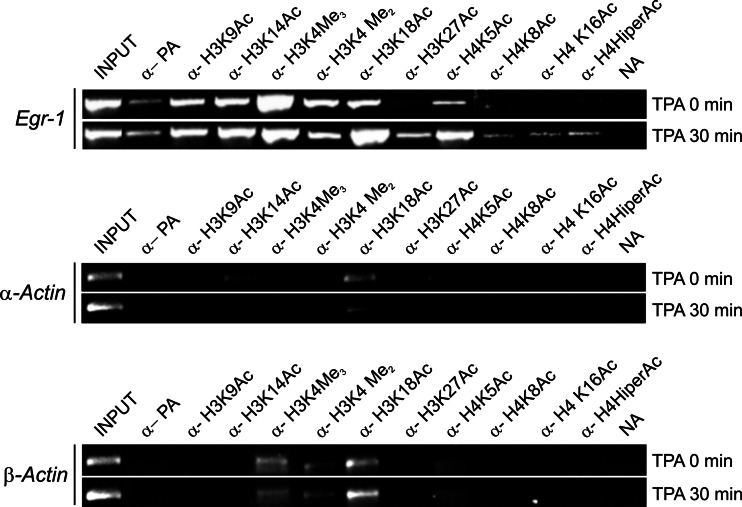
The influence of chromatin on immediate-early gene expression has been studied in a model of Egr1 induction in intact mouse cells. ChIP analysis of factor and RNA polymerase binding reveals that the gene is constitutively poised for transcription in nonstimulated cells, but a repressing chromatin structure hampers productive transcription. Stimulation with phorbol esters results in a transient activation, which starts at 5 min and peaks at 30 min. Quantitative mapping of promoter occupancy by the different factors shows for the first time that no direct competition between SP1 and EGR1 occurs. The phosphorylation of ELK1 and CREB, which involves both the cascades of MEK1/2 and p38 kinases, is required for gene expression, which ceases following the binding of NAB1 and NAB2 to the promoter. The changes in histone acetylation and the differential recruitment of histone-modifying complexes further show the role of chromatin in the activation of this immediate-early gene.
Figures
Similar articles
-
ERK-Induced Activation of TCF Family of SRF Cofactors Initiates a Chromatin Modification Cascade Associated with Transcription.Mol Cell. 2017 Mar 16;65(6):1081-1095.e5. doi: 10.1016/j.molcel.2017.02.005. Epub 2017 Mar 9. Mol Cell. 2017. PMID: 28286024 Free PMC article.
-
Egr-1 induces the expression of its corepressor nab2 by activation of the nab2 promoter thereby establishing a negative feedback loop.J Biol Chem. 2005 Dec 30;280(52):42785-93. doi: 10.1074/jbc.M511079200. Epub 2005 Oct 31. J Biol Chem. 2005. PMID: 16260776
-
Communication between NF-kappa B and Sp1 controls histone acetylation within the proximal promoter of the monocyte chemoattractant protein 1 gene.J Immunol. 2003 Apr 15;170(8):4139-47. doi: 10.4049/jimmunol.170.8.4139. J Immunol. 2003. PMID: 12682245
-
Chromatin-embedded reporter genes: Quantification of stimulus-induced gene transcription.Gene. 2021 Jun 30;787:145645. doi: 10.1016/j.gene.2021.145645. Epub 2021 Apr 20. Gene. 2021. PMID: 33848575 Review.
-
Critical Protein-Protein Interactions Determine the Biological Activity of Elk-1, a Master Regulator of Stimulus-Induced Gene Transcription.Molecules. 2021 Oct 11;26(20):6125. doi: 10.3390/molecules26206125. Molecules. 2021. PMID: 34684708 Free PMC article. Review.
Cited by
-
Retroviral cyclin controls cyclin-dependent kinase 8-mediated transcription elongation and reinitiation.J Virol. 2015 May;89(10):5450-61. doi: 10.1128/JVI.00464-15. Epub 2015 Mar 4. J Virol. 2015. PMID: 25741012 Free PMC article.
-
Epigenetic Mechanisms Are Involved in the Oncogenic Properties of ZNF518B in Colorectal Cancer.Cancers (Basel). 2021 Mar 21;13(6):1433. doi: 10.3390/cancers13061433. Cancers (Basel). 2021. PMID: 33801071 Free PMC article.
-
Epigenetic histone modifications in a clinically relevant rat model of chronic ethanol-binge-mediated liver injury.Hepatol Int. 2014 Sep;8 Suppl 2:421-30. doi: 10.1007/s12072-014-9546-4. Epub 2014 Jun 18. Hepatol Int. 2014. PMID: 26201320
-
Genome-wide approaches reveal EGR1-controlled regulatory networks associated with neurodegeneration.Neurobiol Dis. 2014 Mar;63:107-14. doi: 10.1016/j.nbd.2013.11.005. Epub 2013 Nov 20. Neurobiol Dis. 2014. PMID: 24269917 Free PMC article.
-
GPR43 activation-mediated lipotoxicity contributes to podocyte injury in diabetic nephropathy by modulating the ERK/EGR1 pathway.Int J Biol Sci. 2022 Jan 1;18(1):96-111. doi: 10.7150/ijbs.64665. eCollection 2022. Int J Biol Sci. 2022. PMID: 34975320 Free PMC article.
References
-
- Sandoval J, Rodríguez JL, Tur G, Serviddio G, Pereda J, Boukaba A, Sastre J, Torres L, Franco L, López-Rodas G. RNAPol-ChIP: a novel application of chromatin immunoprecipitation to the analysis of real-time gene transcription. Nucleic Acids Res. 2004;32:e88. doi: 10.1093/nar/gnh091. - DOI - PMC - PubMed
-
- Rodríguez JL, Sandoval J, Serviddio G, Sastre J, Morante M, Perrelli MG, Martínez-Chantar ML, Viña J, Viña JR, Mato JM, Ávila MA, Franco L, López-Rodas G, Torres L. Id2 leaves the chromatin of the E2F4–p130-controlled c-myc promoter during hepatocyte priming for liver regeneration. Biochem J. 2006;398:431–437. doi: 10.1042/BJ20060380. - DOI - PMC - PubMed
-
- Rodríguez JL, Boukaba A, Sandoval J, Georgieva EI, Latasa MU, García-Trevijano ER, Serviddio G, Nakamura T, Avila MA, Sastre J, Torres L, Mato JM, López-Rodas G. Transcription of the MAT2A gene, coding for methionine adenosyltransferase, is up-regulated by E2F and Sp1 at a chromatin level during proliferation of liver cells. Int J Biochem Cell Biol. 2007;39:842–850. doi: 10.1016/j.biocel.2007.01.009. - DOI - PubMed
Publication types
MeSH terms
Substances
LinkOut - more resources
Full Text Sources
Miscellaneous
