. 2010 Dec;12(4):525-36.
doi: 10.1208/s12248-010-9209-x. Epub 2010 Jun 26.

Breast cancer resistance protein (BCRP) and sulfotransferases contribute significantly to the disposition of genistein in mouse intestine

Affiliations

Breast cancer resistance protein (BCRP) and sulfotransferases contribute significantly to the disposition of genistein in mouse intestine

Wei Zhu et al. AAPS J. 2010 Dec.

Abstract

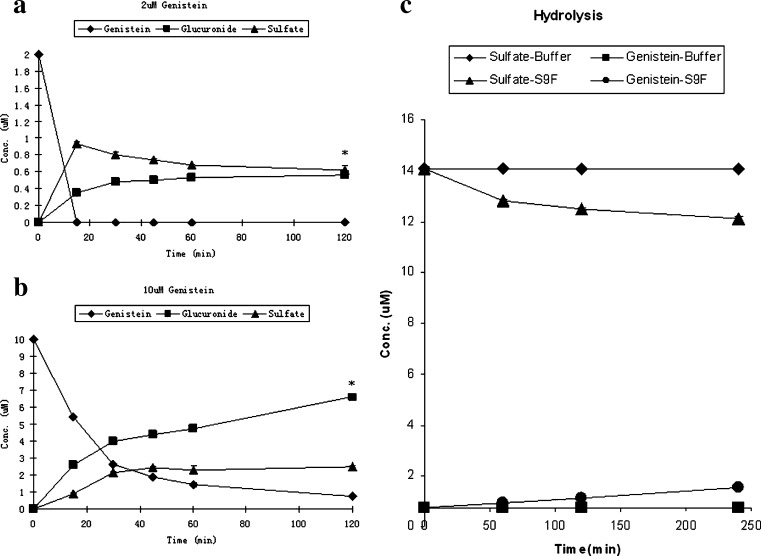
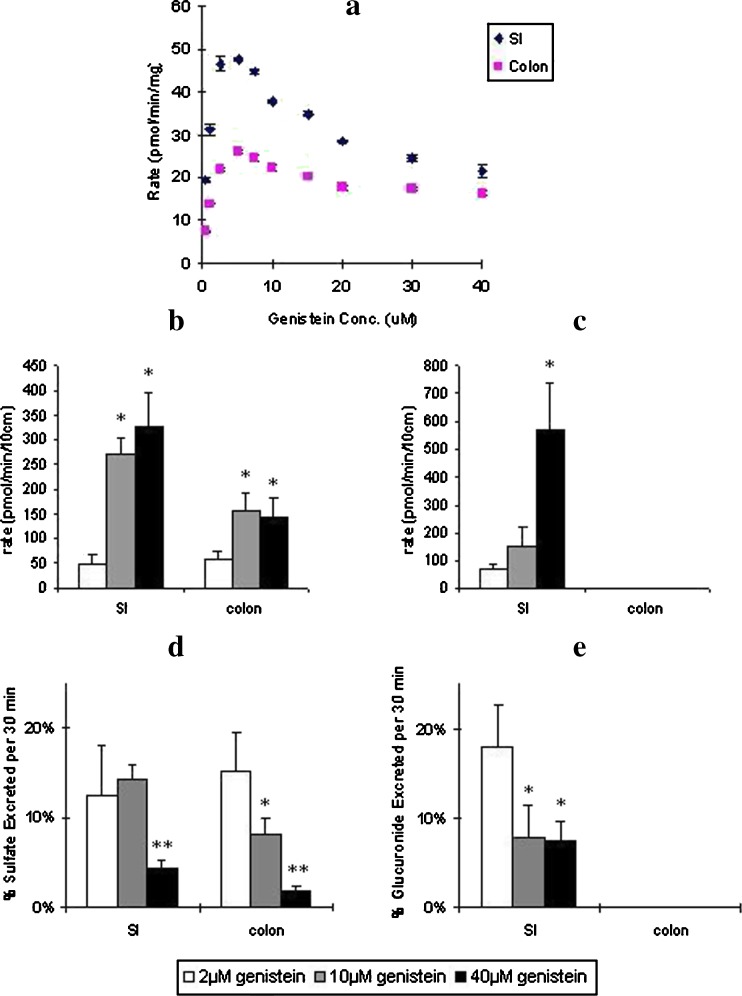
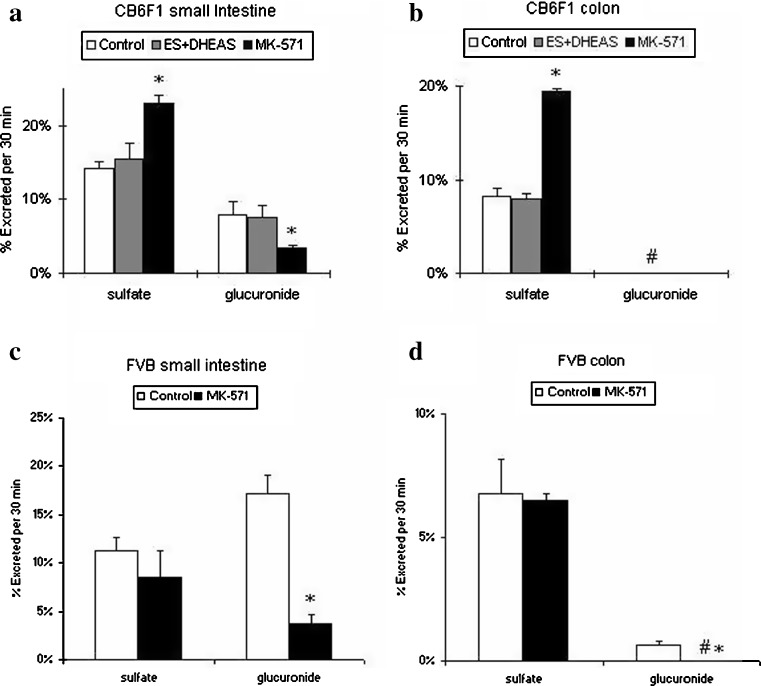
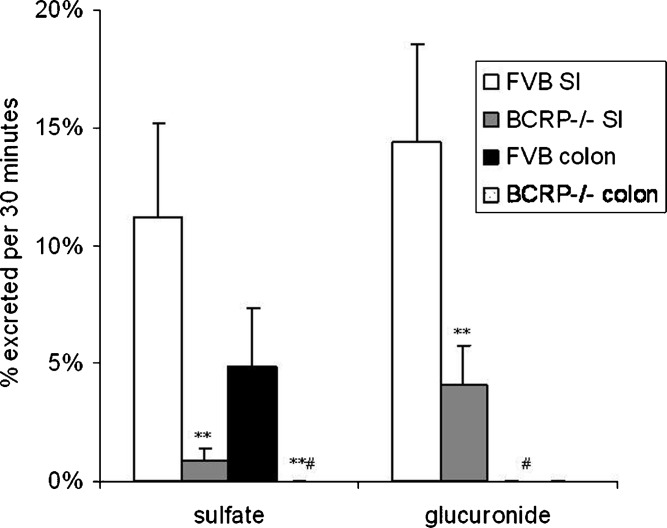
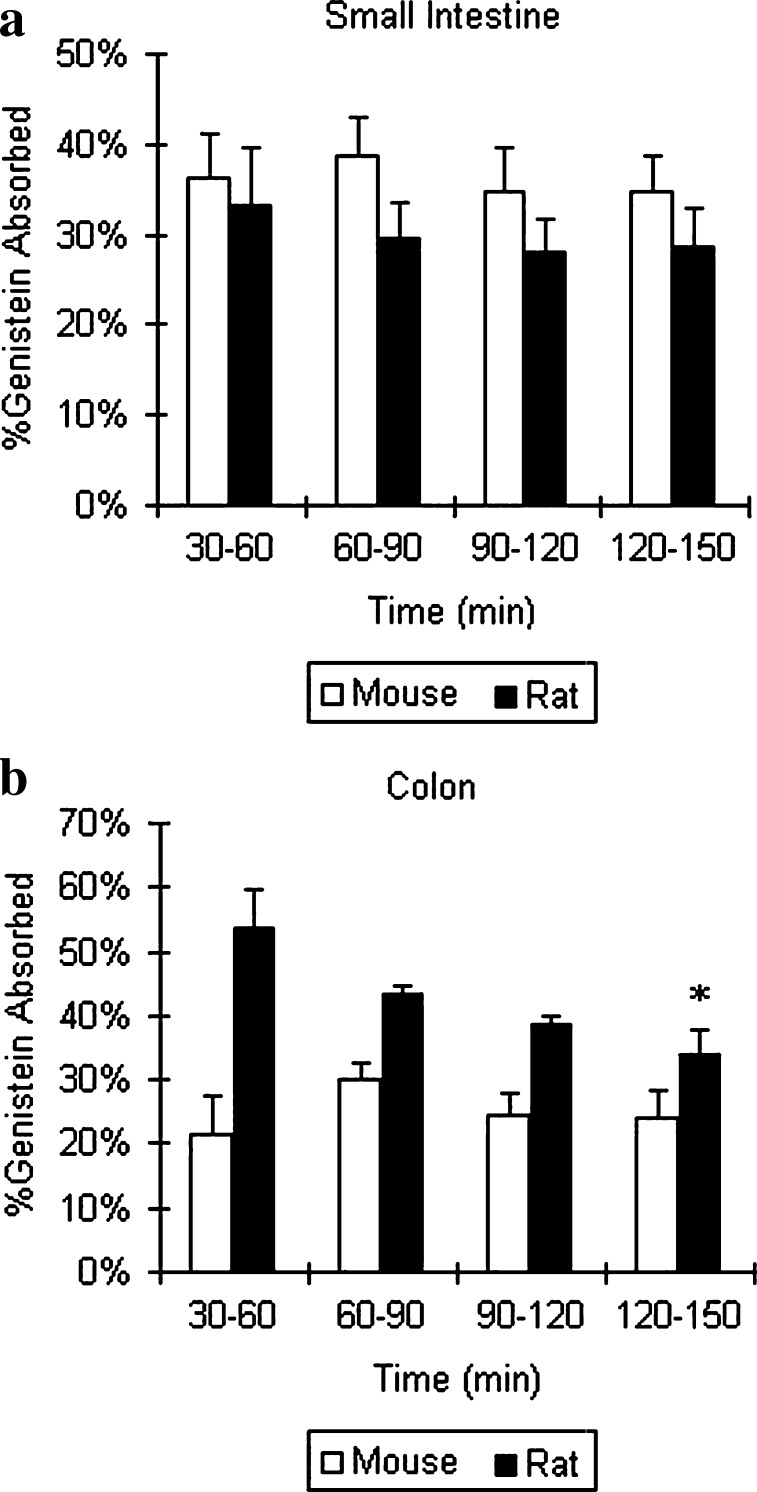
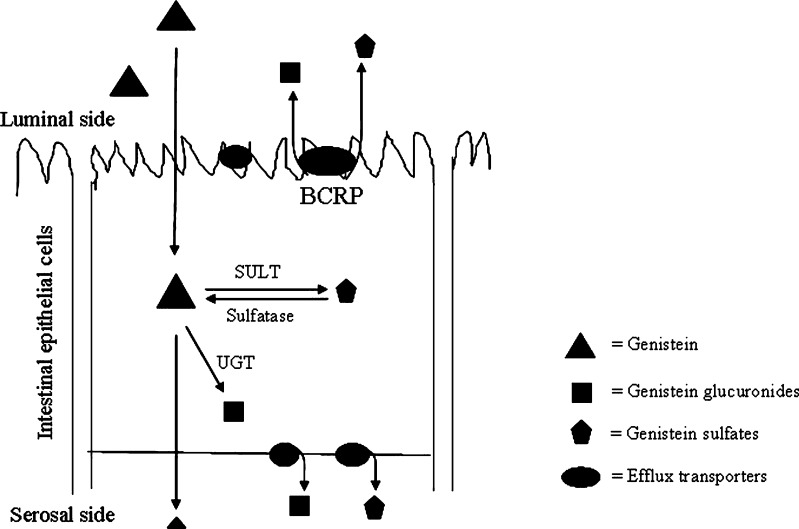
The low bioavailability of genistein has impeded its development into a therapeutic agent. Our earlier studies indicate that glucuronidation is one of the major barriers to genistein oral bioavailability. This study will determine how sulfotransferases and efflux transporters affect its intestinal disposition. A rodent intestinal perfusion model and S9 fractions were used. Sulfate excretion rates were comparable to glucuronide excretion in mouse small intestine but significantly higher than glucuronide excretion in mouse colon, which is different from rat intestinal disposition but similar to disposition in Caco-2 cells. To define efflux transporter(s) involved in sulfate excretion, two organic anion inhibitors (estrone sulfate and dihydroepiandrosterone sulfate) or a multidrug resistance protein inhibitor (MK-571) were used but neither was able to decrease the excretion of genistein sulfates. In contrast, the excretion of genistein sulfate decreased substantially (>90%) in small intestine of breast cancer resistance protein (BCRP) knockout mice and became undetectable in colon of the knockout mice. The excretion rates of genistein glucuronide in the small intestine of BCRP knockout mice were also significant decreased (78%). This study shows clearly that BCRP facilitates the cellular genistein sulfate excretion by removing sulfates to prevent their backward hydrolysis and to limit substrate inhibition, indicating that BCRP plays a dominant role in genistein sulfate excretion and a significant role in genistein glucuronide excretion in the mouse intestine.


Figures

Fig. 1
Fig. 1
UPLC chromatogram and mass spectra of genistein and its conjugated metabolites. a Genistein and its three main conjugates (M1–M3) in a sample spiked with genistein and its three metabolites. b, c, d MS full scan spectra of genistein glucuronide (M1, b), genistein sulfate (M2 and M3, c), and genistein (d), respectively. The small windows in each panel show the MS2 full scan for the respective analyte. e Online UV spectra of genistein and not shown are similar online spectra of its conjugated metabolites
Fig. 2
Fig. 2
Simultaneous glucuronidation and sulfation reactions of genistein at concentrations of a 2 and b 10 μM (n = 3). Also shown is the c hydrolysis of genistein sulfate in FVB mouse small intestinal S9 fractions (n = 3). In a and b, squares, triangles, and diamonds represent concentrations of glucuronides, sulfates, and genistein, respectively. The error bar is the standard deviation of the mean. The symbol “*” means the differences between concentration of glucuronides and sulfates are significant (or p < 0.05) according to one-way ANOVA analysis. In Fig. 3c, concentrations of genistein and its sulfate were obtained from incubation of genistein sulfate with in vitro mouse small intestinal S9 fractions or buffer for a period up to 240 min. In Fig. 3c, triangles and circles represent concentrations of genistein sulfates and genistein in which S9 fractions were present whereas diamonds and squares represent concentrations of genistein sulfates and genistein in which S9 fractions were absent (i.e., only buffer used). The error bar is the standard deviation of the mean, which was derived from an average of three determinations
Fig. 3
Fig. 3
a Effects of genistein concentration on its sulfation in CB6F1 mouse small intestine and colon S9 fractions. Also shown are the effects of genistein concentration on excretion rates of b genistein sulfates and c genistein glucuronides and d percent genistein sulfates and e genistein glucuronides excretion in mouse intestine. In Fig. 4a, sulfation rates were determined from 0.5 to 40 μM of genistein concentration with a reaction time of 60 or 120 min. The diamonds (blue) represent sulfation rate in small intestine and squares (pink) represent sulfation rate in colon. The error bars represent the standard deviation of the mean. In Fig. 4b, c, d, and e, excretion rates of genistein sulfates and glucuronides were obtained from the mouse intestinal perfusion (n = 4). Perfusate solutions containing 2 (open bars), 10 (gray bars), or 40 μM (black bars) genistein were used, and two segments of mouse (small intestine and colon) were perfused simultaneously at a flow rate of 0.191 ml/min. In Fig. 4b and c, excretion of b sulfates or c glucuronides was expressed as amount excreted per minute per 10 cm segment. Excretion of genistein glucuronides was not detected in colon (less than 1 pmol/min/10 cm). The error bars represent the standard deviation of the mean. In Fig. 4d and e, excretion of d sulfates or e glucuronides was expressed as percent excreted per 30 min per 10 cm segment in the mouse intestinal perfusion models. The error bars represent the standard deviation of the mean. The symbols “*” (or p < 0.05) mean the differences of percent excreted between 10 and 40 μM genistein perfusion and 2 μM genistein perfusion in mouse small intestine and colon are significant according to Student’s t test
Fig. 4
Fig. 4
Effects of OAT inhibitor and MRP inhibitor on genistein conjugates excretion in a small intestine and b colon of CB6F1 mouse intestine. Also shown are the effects of MRP inhibitor on genistein conjugates excretion in the c small intestine and d colon in FVB mouse intestine (n = 4). For Fig. 5a and b, perfusate containing 10 μM genistein (white bar), 10 μM genistein plus 1 mM estrone sulfate plus 1 mM dihydroepiandrosterone (DHEA) sulfate (gray bar), and 10 μM genistein plus 50 μM MK-571 (black bar) were used, and two segments of CB6F1 mouse (small intestine and colon) were perfused simultaneously at a flow rate of 0.191 ml/min. For Fig. 5c and d, perfusate containing 10 μM genistein (open bar) and 10 μM genistein plus 50 μM MK-571 (black bar) were used, and two segments of FVB mouse (small intestine and colon) were perfused simultaneously at a flow rate of 0.382 ml/min. Percentage of conjugates excreted during perfusion, normalized to 10 cm intestinal length, were obtained as described in the “MATERIALS AND METHODS” section. The symbol “#” means the percentage of genistein glucuronide excretion in colon was not detected (or less than 0.5% based on our analytical method). The error bars represent the standard deviation of the mean. The symbol “*” means the difference of percent excretion of sulfates or glucuronides between genistein perfusion with inhibitor and control genistein perfusion is significant (or p < 0.05) according to Student’s t test
Fig. 5
Fig. 5
Effects of BCRP on genistein conjugates excretion in small intestine (SI) and colon of mouse (n = 4). Perfusate containing 10 μM genistein were used in wild-type FVB mouse or BCRP−/− mouse, and two segments of mouse (small intestine and colon) were perfused simultaneously at a flow rate of 0.191 ml/min. Percentage of sulfates (left panel) and glucuronides (right panel) excreted during perfusion, normalized to 5 cm intestinal length, were obtained as described in the “MATERIALS AND METHODS” section. The symbol “#” means the percentage of genistein glucuronide excretion in FVB and BCRP−/− mice colon and percentage of genistein sulfate excretion in BCRP−/− mice colon were not detected (or less than 0.5% based on our analytical method). The error bars represent the standard deviation of the mean. The symbol “**” means the difference of percent excretion of genistein sulfates or glucuronides excreted in small intestine and colon between BCRP−/− mice and FVB mice is significant (or p < 0.01) according to Student’s t test
Fig. 6
Fig. 6
Genistein absorption in a small intestine and b colon in mouse and rat perfusion models (n = 4). Perfusate containing 10 μM genistein was used, and two segments of mouse (small intestine and colon) and four segments of rat (duodenum, jejunum, ileum, and colon) were perfused simultaneously at a flow rate of 0.191 ml/min. Percentage of genistein absorbed during 150 min perfusion, normalized to 10 cm intestinal length, was obtained as described in the “MATERIALS AND METHODS” section. The error bars represent the standard deviation of the mean. The open bars and black bars represent percentages of genistein absorption in mouse and in rat intestine, respectively. More than 15% of absorption is considered that genistein was well absorbed. The symbol “*” means the difference of percent absorption between mouse colon and rat colon during 150 min perfusion is significant (or p < 0.05) according to one-way ANOVA
Fig. 7
Fig. 7
Schematic diagram of genistein disposition in intestine. Absorption of genistein into the epithelial cells is fast, while the aglycone undergoes extensive phase II metabolism in the cells results in low bioavailability in vivo. BCRP facilitates the cellular genistein sulfate excretion by rapidly removing sulfates from the cytosolic domain to the lumen to prevent their backward hydrolysis which is catalyzed by sulfatases. If sulfates are not removed from the cells, they will be hydrolyzed back to aglycones and ultimate results in often more production of glucuronides (catalyzed by UGTs)

Similar articles

Cited by

References

    1. Kurzerand MS, Xu X. Dietary phytoestrogens. Annu Rev Nutr. 1997;17:353–381. doi: 10.1146/annurev.nutr.17.1.353. - DOI - PubMed
    1. Lamartiniere CA, Cotroneo MS, Fritz WA, Wang J, Mentor-Marcel R, Elgavish A. Genistein chemoprevention: timing and mechanisms of action in murine mammary and prostate. J Nutr. 2002;132:552S–558S. - PubMed
    1. Cao F, Jin TY, Zhou YF. Inhibitory effect of isoflavones on prostate cancer cells and PTEN gene. Biomed Environ Sci. 2006;19:35–41. - PubMed
    1. Gu Y, Zhu CF, Iwamoto H, Chen JS. Genistein inhibits invasive potential of human hepatocellular carcinoma by altering cell cycle, apoptosis, and angiogenesis. World J Gastroenterol. 2005;11:6512–6517. - PMC - PubMed
    1. Kim EJ, Shin HK, Park JH. Genistein inhibits insulin-like growth factor-I receptor signaling in HT-29 human colon cancer cells: a possible mechanism of the growth inhibitory effect of Genistein. J Med Food. 2005;8:431–438. doi: 10.1089/jmf.2005.8.431. - DOI - PubMed

Substances

LinkOut - more resources