Discovery and verification of amyotrophic lateral sclerosis biomarkers by proteomics
- PMID: 20583124
- PMCID: PMC2975276
- DOI: 10.1002/mus.21683
Discovery and verification of amyotrophic lateral sclerosis biomarkers by proteomics
Abstract
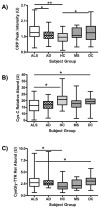
Recent studies using mass spectrometry have discovered candidate biomarkers for amyotrophic lateral sclerosis (ALS). However, those studies utilized small numbers of ALS and control subjects. Additional studies using larger subject cohorts are required to verify these candidate biomarkers. Cerebrospinal fluid (CSF) samples from 100 patients with ALS, 100 disease control, and 41 healthy control subjects were examined by mass spectrometry. Sixty-one mass spectral peaks exhibited altered levels between ALS and controls. Mass peaks for cystatin C and transthyretin were reduced in ALS, whereas mass peaks for posttranslational modified transthyretin and C-reactive protein (CRP) were increased. CRP levels were 5.84 +/- 1.01 ng/ml for controls and 11.24 +/- 1.52 ng/ml for ALS subjects, as determined by enzyme-linked immunoassay. This study verified prior mass spectrometry results for cystatin C and transthyretin in ALS. CRP levels were increased in the CSF of ALS patients, and cystatin C level correlated with survival in patients with limb-onset disease. Our biomarker panel predicted ALS with an overall accuracy of 82%.
Figures


References
-
- Mitchell JD, Borasio GD. Amyotrophic lateral sclerosis. Lancet. 2007;369:2031–2041. - PubMed
-
- Worms PM. The epidemiology of motor neuron diseases: a review of recent studies. J Neurol Sci. 2001;191:3–9. - PubMed
-
- O'Toole O, Traynor BJ, Brennan P, Sheehan C, Frost E, Corr B, et al. Epidemiology and clinical features of amyotrophic lateral sclerosis in Ireland between 1995 and 2004. J Neurol Neurosurg Psychiatry. 2008;79:30–32. - PubMed
-
- Ryberg H, Bowser R. Protein biomarkers for amyotrophic lateral sclerosis. Expert Rev Proteomics. 2008;5:249–262. - PubMed
-
- Luo X, Carlson KA, Wojna V, Mayo R, Biskup TM, Stoner J, et al. Macrophage proteomic fingerprinting predicts HIV-1-associated cognitive impairment. Neurology. 2003;60:1931–1937. - PubMed
Publication types
MeSH terms
Substances
Grants and funding
LinkOut - more resources
Full Text Sources
Other Literature Sources
Medical
Research Materials
Miscellaneous

