. 2010 Jul;34(5):434-43.
doi: 10.1002/gepi.20496.

An "almost exhaustive" search-based sequential permutation method for detecting epistasis in disease association studies

Affiliations

An "almost exhaustive" search-based sequential permutation method for detecting epistasis in disease association studies

Li Ma et al. Genet Epidemiol. 2010 Jul.

Abstract

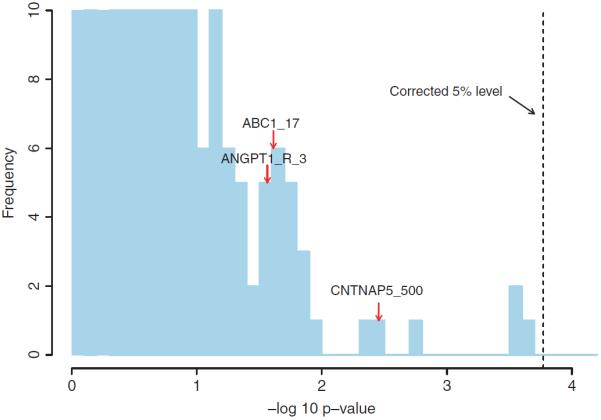
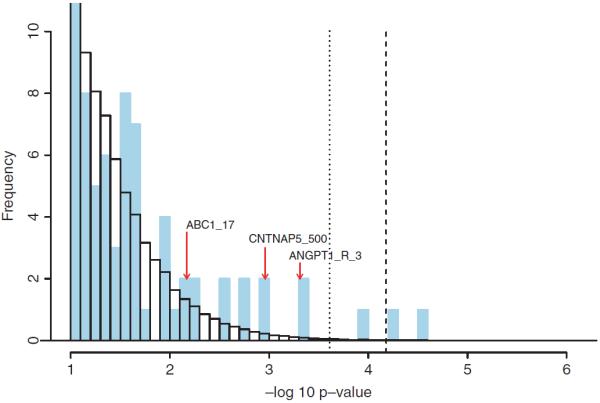
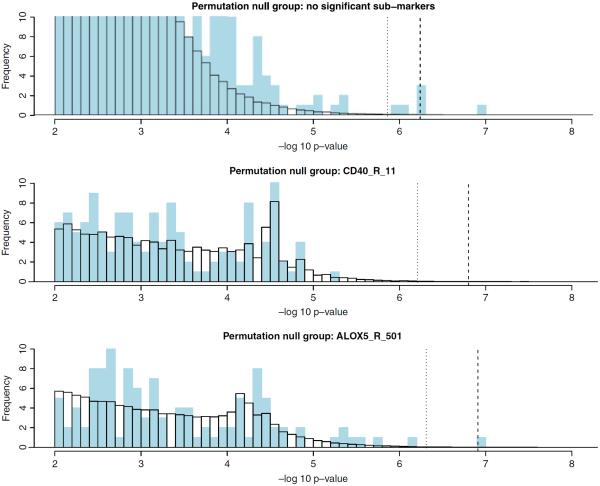
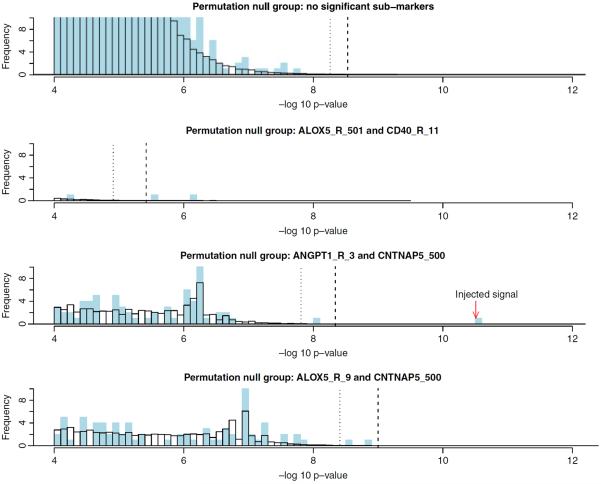
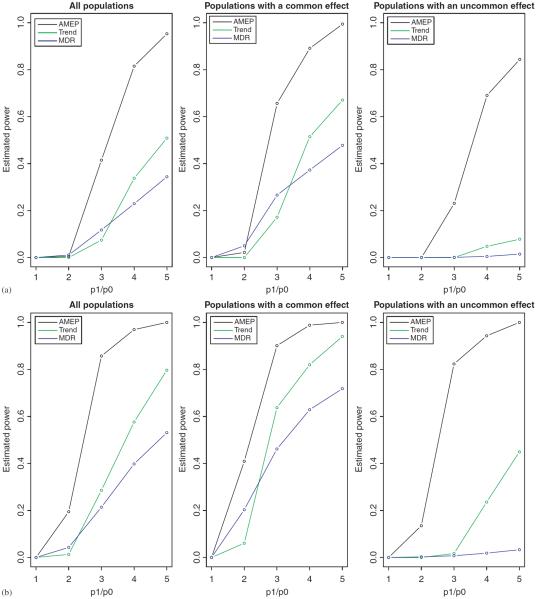
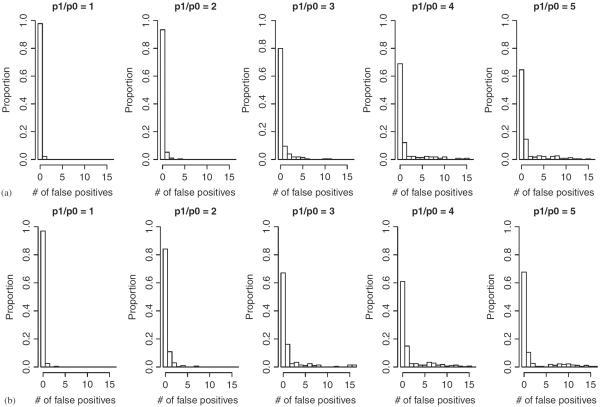
Due to the complex nature of common diseases, their etiology is likely to involve "uncommon but strong" (UBS) interactive effects--i.e. allelic combinations that are each present in only a small fraction of the patients but associated with high disease risk. However, the identification of such effects using standard methods for testing association can be difficult. In this work, we introduce a method for testing interactions that is particularly powerful in detecting UBS effects. The method consists of two modules--one is a pattern counting algorithm designed for efficiently evaluating the risk significance of each marker combination, and the other is a sequential permutation scheme for multiple testing correction. We demonstrate the work of our method using a candidate gene data set for cardiovascular and coronary diseases with an injected UBS three-locus interaction. In addition, we investigate the power and false rejection properties of our method using data sets simulated from a joint dominance three-locus model that gives rise to UBS interactive effects. The results show that our method can be much more powerful than standard approaches such as trend test and multifactor dimensionality reduction for detecting UBS interactions.


Figures

Fig. 1
Fig. 1
A truncated histogram of the trend test −log10 p-values. The frequency (vertical axis) is truncated at 10. The dashed vertical line indicates the permutation corrected 5% level. The three markers involved in our injected signal fall into the bars indicated by the red arrows.
Fig. 2
Fig. 2
Truncated histogram of −log10 p-values for 1-patterns. The vertical axis is truncated above at 10 and the horizontal axis is truncated below at 1. The blue bars represent 1-patterns observed in the data. The white bars (with black borders) represent the average histogram over all the permuted data sets. The dashed line indicates the 5% corrected p-value cutoff. The dotted line represents pnfp0.2. The three markers involved in our injected signal fall into the bars indicated by the red arrows.
Fig. 3
Fig. 3
Truncated histograms of −log10 p-values for 2-patterns. Three permutation null groups are plotted. The vertical axes are truncated above at 10 and the horizontal axes are truncated below at 2. The blue bars represent the 2-patterns observed in the data. The white bars (with black borders) represent the average histogram over all the permuted data sets. The dashed line indicates the 5% corrected p-value cutoff. The dotted line represents pnfp0.2.
Fig. 4
Fig. 4
Truncated histograms of −log10 p-values for 3-patterns. Four permutation null groups are plotted. The vertical axes are truncated above at 10 and the horizontal axes are truncated below at 4. The blue bars represent the 3-patterns observed in the data. The white bars (with black borders) represent the average histogram over all the permuted data sets. The dashed line indicates the 5% corrected p-value cutoff. The dotted line represents pnfp0.2.
Fig. 5
Fig. 5
The power estimates of three different methods for the simulated joint dominance data. Left column: all populations. Middle column: populations in which the causal combinations exist in more than 20% of patients. Right column: populations in which the causal combinations exist in no more than 20% of patients. Two sets of sample sizes: (a) N0=N1=500 and (b) N0=N1=1000.
Fig. 6
Fig. 6
Histograms of the number of false rejections produced by AMEP for the simulated data under the three-locus joint dominance model. The x-axes are truncated at 16. Two sets of sample sizes: (a) N0=N1=500. (b) N0=N1=1000.

References

    1. Assimes TL, Knowles JW, Basu A, Iribarren C, Southwick A, Tang H, Absher D, Li J, Fair JM, Rubin GD, Sidney S, Fortmann SP, Go AS, Hlatky MA, Myers RM, Risch N, Quertermous T. Susceptibility locus for clinical and subclinical coronary artery disease at chromosome 9p21 in the multi-ethnic ADVANCE study. Hum Mol Genet. 2008;17:2320–2328. - PMC - PubMed
    1. Borgelt C. Workshop Open Source Data Mining Software (OSDM'05) CM Press; New York, Illinois: 2005. An implementation of the fp-growth algorithm; pp. 1–5.
    1. Bush WS, Dudek SM, Ritchie MD. Parallel multifactor dimensionality reduction: a tool for the large-scale analysis of gene-gene interactions. Bioinformatics. 2006;22:2173–2174. - PMC - PubMed
    1. Cordell HJ. Detecting gene–gene interactions that underlie human diseases. Nature Rev Genet. 2009;10:392–404. - PMC - PubMed
    1. Han J, Pei J, Yin Y, Mao R. Mining frequent patterns without candidate generation: a frequent-pattern tree approach. Data Min Knowl Discov. 2004;8:53–87.

Publication types

Substances

LinkOut - more resources