. 2010 Oct;64(10):2952-68.
doi: 10.1111/j.1558-5646.2010.01068.x. Epub 2010 Aug 19.

Chemotherapy, within-host ecology and the fitness of drug-resistant malaria parasites

Affiliations

Chemotherapy, within-host ecology and the fitness of drug-resistant malaria parasites

Silvie Huijben et al. Evolution. 2010 Oct.

Abstract

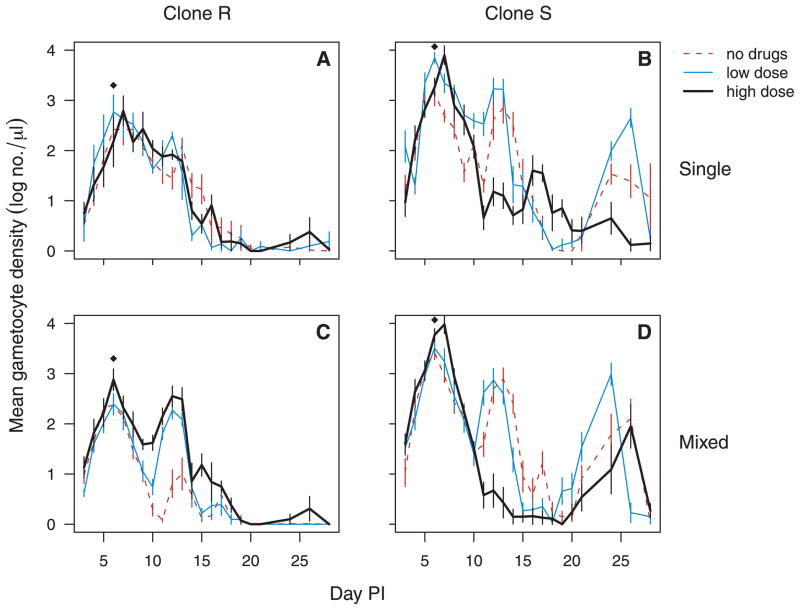
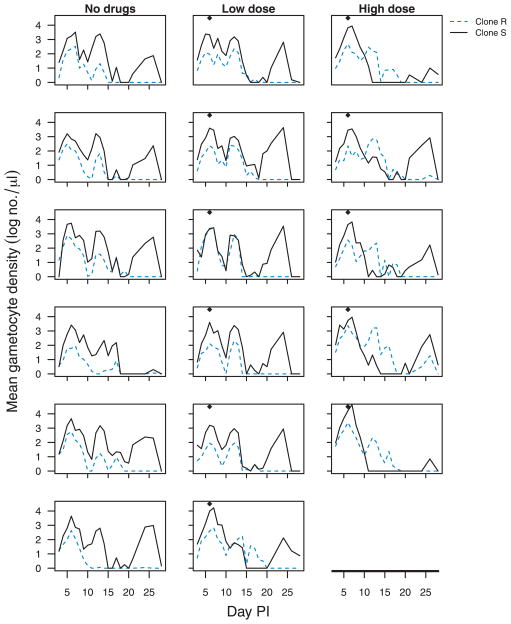
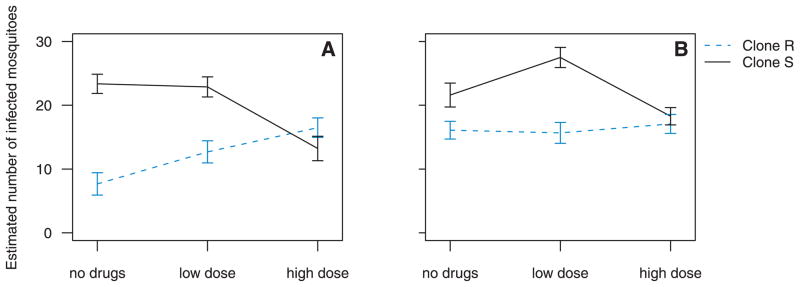
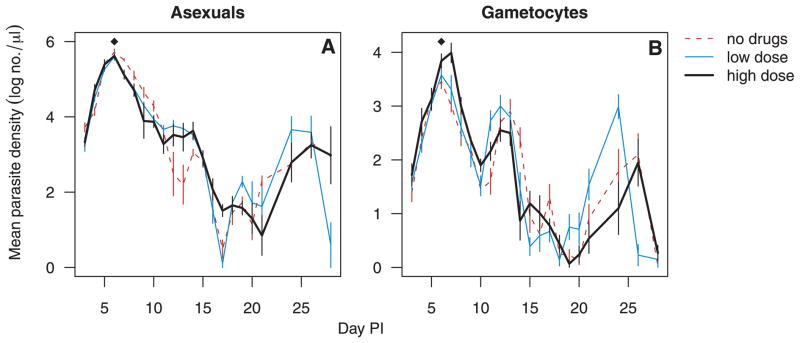
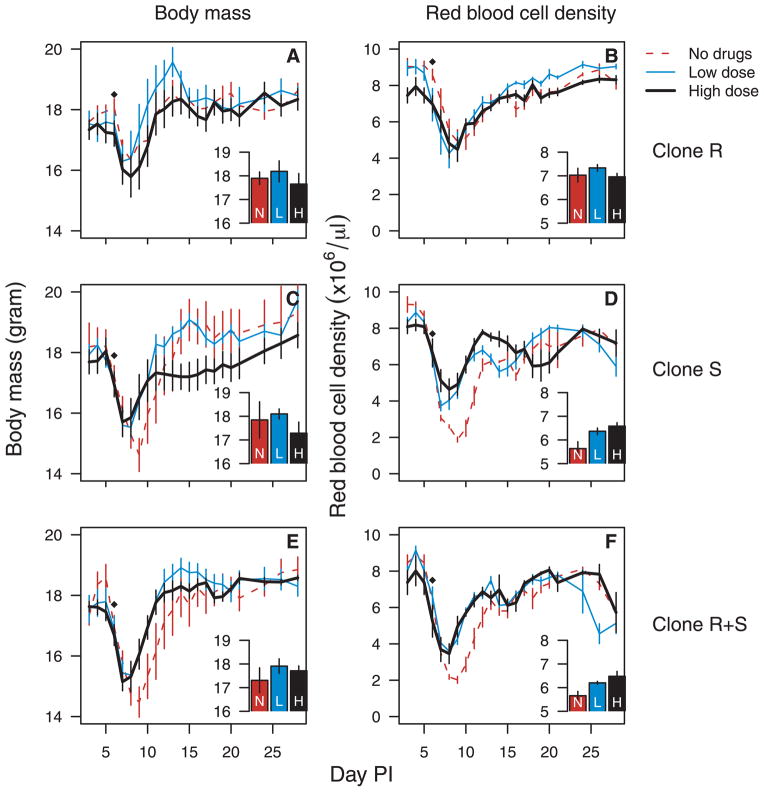
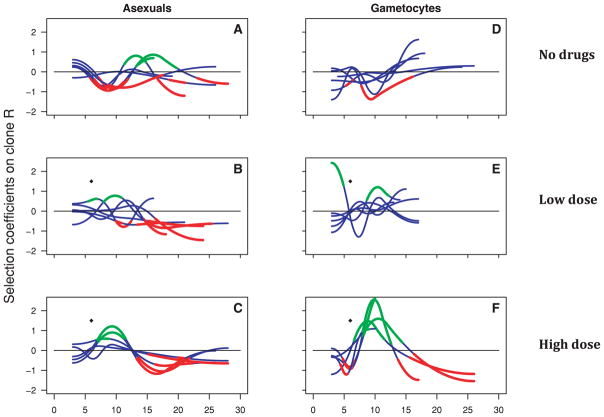
A major determinant of the rate at which drug-resistant malaria parasites spread through a population is the ecology of resistant and sensitive parasites sharing the same host. Drug treatment can significantly alter this ecology by removing the drug-sensitive parasites, leading to competitive release of resistant parasites. Here, we test the hypothesis that the spread of resistance can be slowed by reducing drug treatment and hence restricting competitive release. Using the rodent malaria model Plasmodium chabaudi, we found that low-dose chemotherapy did reduce competitive release. A higher drug dose regimen exerted stronger positive selection on resistant parasites for no detectable clinical gain. We estimated instantaneous selection coefficients throughout the course of replicate infections to analyze the temporal pattern of the strength and direction of within-host selection. The strength of selection on resistance varied through the course of infections, even in untreated infections, but increased immediately following drug treatment, particularly in the high-dose groups. Resistance remained under positive selection for much longer than expected from the half life of the drug. Although there are many differences between mice and people, our data do raise the question whether the aggressive treatment regimens aimed at complete parasite clearance are the best resistance-management strategies for humans.


Figures

Figure 1
Figure 1
Density–infectivity q-functions used in the analysis: probability of a single mosquito becoming infectious based on gametocyte density. Function q1 (black dashed line) is based on data from Barnes and White (2005), q2 (red solid line) is based on data from Carter and Graves (1988). Probability of infection was calculated using eq. (3) and parameters α = 0.03, β = 0.6, α/γ = 0.85 for q1 and α = 1·10−5, β = 2, α/γ = 1 for q2. Infectivity saturates at α/γ. Gametocyte density is plotted on a log scale.
Figure 2
Figure 2
Parasite densities of the drug-resistant clone R (left panels) and the drug-sensitive clone S (right panels) in single (top panels) and mixed (bottom panels) infections that were either left untreated (dashed red line), received a low drug dose (solid blue line) or high dose (thick black line). Black diamonds indicate the timing of drug-treatment at day 6 postinfection. Data are geometric means (±standard error) for up to six mice (Table 1).
Figure 3
Figure 3
Asexual parasite dynamics of individual mice that were infected with a mixed infection of clone R (dashed blue line) and clone S (solid black line), which received no drug treatment (left column), a low dose of pyrimethamine (middle column) or a high dose of pyrimethamine (right column). Each group consisted of six mice at the outset of the experiment; however, one mouse in the high-dose treatment group received a much lower parasite dose than intended and was excluded (Table 1). Drug treatment was given on day 6 postinfection, as indicated by the black diamonds.
Figure 4
Figure 4
Geometric mean asexual parasite density (±standard error) of clone R (left plot) and clone S (right plot) in single and mixed infections that were either left untreated (dashed red line), received a low drug dose (solid blue line) or high dose (solid black line). Data are the arithmetic means of the geometric mean density per day over the course of posttreatment infection for up to six mice (Table 1).
Figure 5
Figure 5
Gametocyte densities of the drug-resistant clone R (left panels) and the drug-sensitive clone S (right panels) in single (top panels) and mixed (bottom panels) infections that were either left untreated (dashed red line), received a low drug dose (solid blue line) or high dose (thick black line). Black diamonds indicate the timing of drug-treatment at day 6 postinfection. Data are geometric means (±standard error) for up to six mice (Table 1).
Figure 6
Figure 6
Gametocyte dynamics of individual mice that were infected with a mixed infection of clone R (dashed blue line) and clone S (solid black line), which were either left untreated (left column), received a low drug dose (middle column) or high dose (right column). Each group consisted of six mice at the outset of the experiment; however, one mouse in the high-dose treatment group received a much lower parasite dose than intended and was excluded (Table 1). Drug treatment was given on day 6 postinfection, as indicated by the black diamonds.
Figure 7
Figure 7
Least square mean (±standard error) predicted number of infected mosquitoes (out of n = 100) with clone R (dashed blue line) and clone S (solid black line) from mixed (A) and single (B) infections that were either left untreated, received a low drug dose or high drug dose. Predicted infectivity is based on the posttreatment gametocyte densities using density-infectivity function q1 (Fig. 1); a similar picture was seen using function q2. Least square means and standard errors were calculated from the statistical model containing gametocyte density on day 6 as a covariate.
Figure 8
Figure 8
Total asexual parasite (left graph) and gametocyte (right graph) dynamics of mixed infections that were either left untreated (dashed red line), received a low drug dose (solid blue line) or high dose (thick black line). Black diamonds indicate the timing of drug-treatment at day 6 postinfection. Data are geometric means (±standard error) for up to six mice (Table 1).
Figure 9
Figure 9
Body mass (±standard error, left panels) and red blood cell density (±standard error, right panels) of mice infected with drug-resistant clone R (top panels), drug-sensitive clone S (middle panels), and mixed infections of both clones (bottom panels) for untreated infections (dashed red line), low-dose treatment (solid blue line) and high-dose treatment (thick black line). Black diamonds indicate timing of drug treatment at day 6 postinfection. The inset bar charts show the mean body mass and mean red blood cell density posttreatment (±standard error) for untreated infections (red bars—“N”), low-dose treatments (blue bars—“L”) and high-dose treatments (black bars—“H”). All data are arithmetic means for up to six mice (Table 1).
Figure 10
Figure 10
Asexual (left panels) and gametocyte (right panels) selection dynamics of clone R for each mouse in mixed infections that were either untreated (upper panels), received low-dose treatment (middle panels) or high-dose treatment (bottom panels). Lines are the mean selection dynamics with blue segments denoting times when selection is not statistically different from zero, red segments times when selection is statistically less than zero, and green segments times when selection is greater than zero. Black diamonds indicate timing of drug treatment at day 6 postinfection. Selection could be calculated up to the last day that both clones were detectable, which varied between mice.

Similar articles

Cited by

References

    1. A-Elbasit IE, ElGhazali G, A-Elgadir TME, Hamad AA, Babiker HA, Elbashir MI, Giha HA. Allelic polymorphism of MSP2 gene in severe P. falciparum malaria in an area of low and seasonal transmission. Parasitol Res. 2007;102:29–34. - PubMed
    1. Abdel-Muhsin AMA, Mackinnon MJ, Ali E, Nassir EKA, Suleiman S, Ahmed S, Walliker D, Babiker HA. Evolution of drug-resistance genes in Plasmodium falciparum in an area of seasonal malaria transmission in Eastern Sudan. J Infect Dis. 2004;189:1239–1244. - PubMed
    1. Ali E, Mackinnon MJ, Abdel-Muhsin AMA, Ahmed S, Walliker D, Babiker HA. Increased density but not prevalence of gametocytes following drug treatment of Plasmodium falciparum. Trans R Soc Trop Med Hyg. 2006;100:176–183. - PubMed
    1. Arnot DE. Clone multiplicity of Plasmodium falciparum infections in individuals exposed to variable levels of disease transmission. Trans R Soc Trop Med Hyg. 1998;92:580–585. - PubMed
    1. Babiker HA. Seasonal fluctuation of drug-resistant malaria parasites: a sign of fitness cost. Trends Parasitol. 2009;25:351–352. - PubMed

Publication types