. 2010 May;31(10):1772-82.
doi: 10.1111/j.1460-9568.2010.07213.x.

Onset timing of cross-sensory activations and multisensory interactions in auditory and visual sensory cortices

Affiliations

Onset timing of cross-sensory activations and multisensory interactions in auditory and visual sensory cortices

Tommi Raij et al. Eur J Neurosci. 2010 May.

Abstract

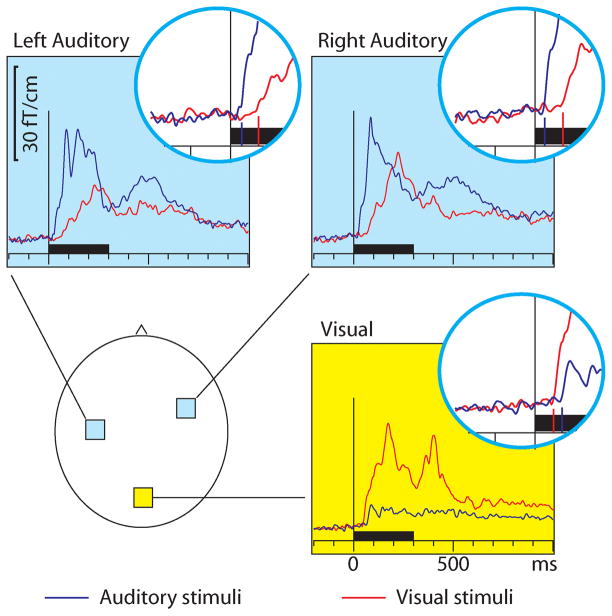
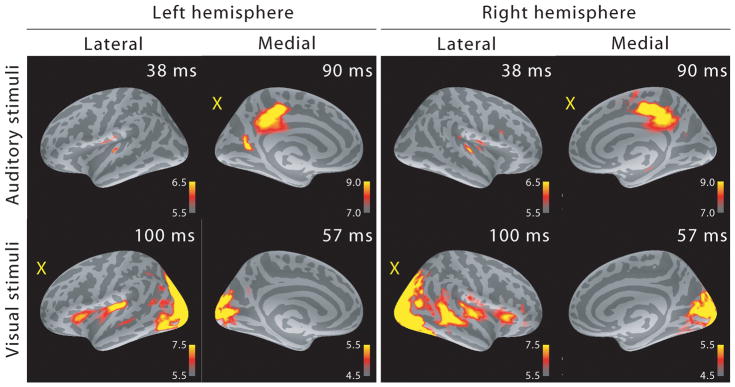
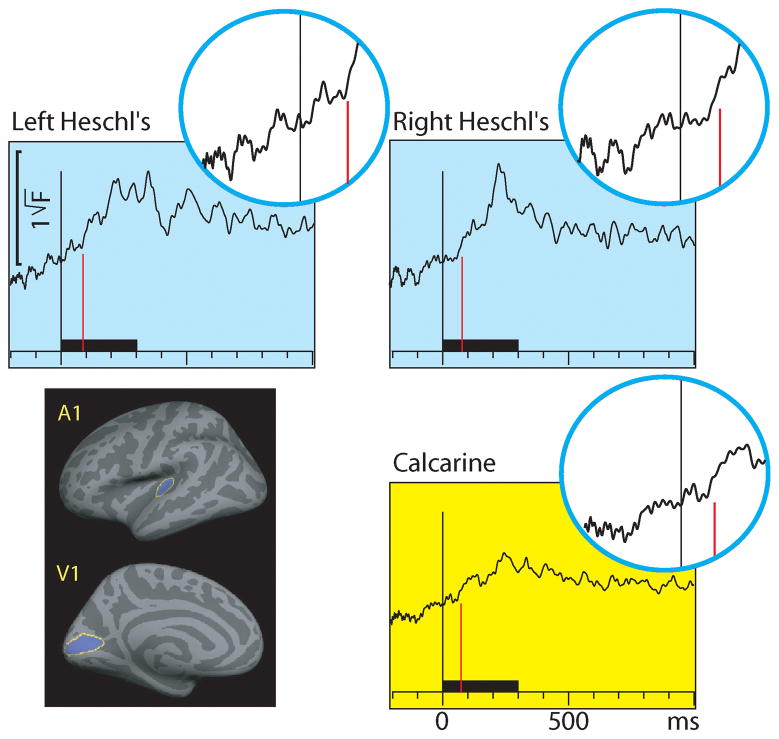
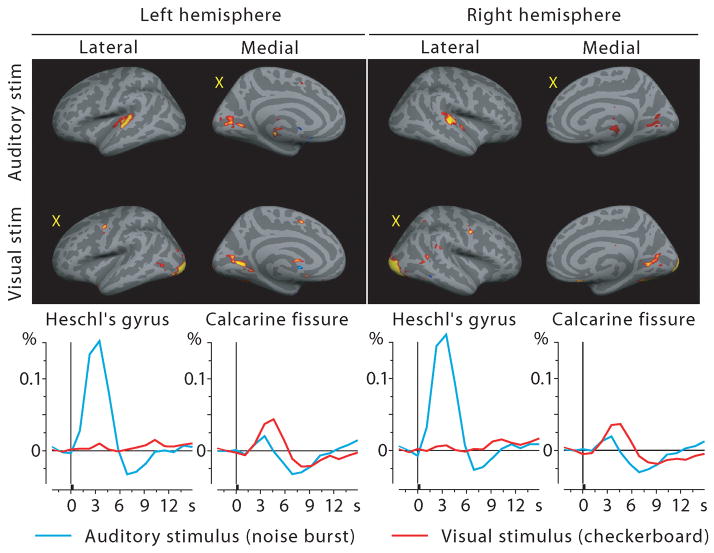
Here we report early cross-sensory activations and audiovisual interactions at the visual and auditory cortices using magnetoencephalography (MEG) to obtain accurate timing information. Data from an identical fMRI experiment were employed to support MEG source localization results. Simple auditory and visual stimuli (300-ms noise bursts and checkerboards) were presented to seven healthy humans. MEG source analysis suggested generators in the auditory and visual sensory cortices for both within-modality and cross-sensory activations. fMRI cross-sensory activations were strong in the visual but almost absent in the auditory cortex; this discrepancy with MEG possibly reflects the influence of acoustical scanner noise in fMRI. In the primary auditory cortices (Heschl's gyrus) the onset of activity to auditory stimuli was observed at 23 ms in both hemispheres, and to visual stimuli at 82 ms in the left and at 75 ms in the right hemisphere. In the primary visual cortex (Calcarine fissure) the activations to visual stimuli started at 43 ms and to auditory stimuli at 53 ms. Cross-sensory activations thus started later than sensory-specific activations, by 55 ms in the auditory cortex and by 10 ms in the visual cortex, suggesting that the origins of the cross-sensory activations may be in the primary sensory cortices of the opposite modality, with conduction delays (from one sensory cortex to another) of 30-35 ms. Audiovisual interactions started at 85 ms in the left auditory, 80 ms in the right auditory and 74 ms in the visual cortex, i.e., 3-21 ms after inputs from the two modalities converged.


Figures

Figure 1
Figure 1
MEG sensor responses over the auditory (light blue background) and visual (yellow background) cortices for auditory (blue traces) and visual (red traces) stimuli; the approximate sensor locations are shown in the lower left panel. The circular insets show the beginning of the response enlarged twofold, with vertical lines where the onsets were found; the corresponding numerical values are reported in Table 1. The responses show the magnetic field gradient amplitudes as a function of time. From each subject, the sensor location showing the maximal ~100 ms sensory-specific activation was selected, and the signals from these sensors were averaged across subjects. Sensors over both auditory and visual cortices show cross-sensory activations, but these are stronger over the auditory than the visual cortex. The sensory-specific activations occur earlier than the cross-sensory activations, especially over the auditory cortices. Time scales −200 to +1000 ms post stimulus, stimulus duration 300 ms (black bar).
Figure 2
Figure 2
MEG source analysis snapshots (dSPM F-statistics) picked at early activation latencies. Both sensory-specific and cross-sensory (marked with a yellow “X”) activations are seen (the right hemisphere calcarine cortex cross-sensory activity is not visible at this threshold). While some of the cross-sensory activations are located inside the sensory areas (as delineated in (Desikan et al., 2006)), these seem to occupy slightly different locations than the sensory-specific activations. However, the spatial resolution of MEG is somewhat limited – hence exact comparisons are discouraged. Visual checkerboard stimuli activated additional areas outside the sensory cortices, for example superior temporal sulci (STS) especially in the right hemisphere and Broca’s areas bilaterally.
Figure 3
Figure 3
MEG source-specific (dSPM) time courses for Heschl’s gyri (auditory cortex; light blue background) and calcarine fissure (visual cortex; yellow background) to auditory and visual stimuli; responses to AV stimuli are not shown. The source areas, shown for the left hemisphere in the lower left panel, were based on an anatomical parcellation (Desikan et al., 2006); left and right calcarine sources were averaged. The circular insets show the beginning of each response enlarged twofold, with vertical lines where the onsets for auditory (blue traces) and visual (red traces) stimuli were found; the corresponding numerical values are reported in Table 3. Both sensory-specific and cross-sensory activations are observed. The sensory-specific activations occur earlier than the cross-sensory activations, especially in the auditory cortices. Time scales –200 to +1000 ms post stimulus, stimulus duration 300 ms (black bar).
Figure 4
Figure 4
MEG source-specific (dSPM) audiovisual interaction [AV-(A+V)] time courses from Heschl’s gyri (auditory cortex; light blue background) and calcarine fissure (visual cortex; yellow background). The circular insets show the beginning of each response enlarged twofold, with vertical lines where the onsets were found; the corresponding numerical values are reported in Table 3. Interactions are observed in both the auditory and visual cortices, starting 3–21 ms after the inputs from both sensory modalities converge in the sensory cortex. Time scales –200 to +1000 ms post stimulus, stimulus duration 300 ms (black bar).
Figure 5
Figure 5
fMRI activations to auditory and visual stimuli projected on the inflated cortex at the 4th time frame after stimulus onset (top) and the corresponding BOLD % signal change time courses from Heschl’s gyrus and calcarine fissure (bottom). Sensory-specific activations are very clear; cross-sensory responses are strong in Calcarine fissure but almost absent in Heschl’s gyri (see Discussion). Yellow X letters in the brain images mark cross-sensory conditions. Responses to AV stimuli and audiovisual interactions not shown.

References

    1. Bandettini P, Jesmanowicz A, Van Kylen J, Birn R, Hyde J. Functional MRI of brain activation induced by scanner acoustic noise. Magn Reson Med. 1998;39:410–416. - PubMed
    1. Bar M, Kassam K, Ghuman A, Boshyan J, Schmid A, Dale A, Hämäläinen M, Marinkovic K, Schacter D, Rosen B, Halgren E. Top-down facilitation of visual recognition. Proc Natl Acad Sci USA. 2006;103:449–454. - PMC - PubMed
    1. Benevento L, Fallon J, Davis B, Rezak M. Auditory-visual interaction in single cells in the cortex of the superior temporal sulcus and orbital cortex of the macaque monkey. Exp Neurol. 1977;57:849–872. - PubMed
    1. Besle J, Fischer C, Bidet-Caulet A, Lecaignard F, Bertrand O, Giard M. Visual activation and audiovisual interactions in the auditory cortex during speech perception: intracranial recordings in humans. J Neurosci. 2008;28:14301–14310. - PMC - PubMed
    1. Bruce C, Desimone R, Gross C. Both striate cortex and superior colliculus contribute to visual properties of neurons in superior temporal polysensory area of macaque monkey. J Neurophysiol. 1986;55:1057–1075. - PubMed

Publication types