Meta-analysis of cotton fiber quality QTLs across diverse environments in a Gossypium hirsutum x G. barbadense RIL population
- PMID: 20584292
- PMCID: PMC3017793
- DOI: 10.1186/1471-2229-10-132
Meta-analysis of cotton fiber quality QTLs across diverse environments in a Gossypium hirsutum x G. barbadense RIL population
Abstract
Background: Cotton fibers (produced by Gossypium species) are the premier natural fibers for textile production. The two tetraploid species, G. barbadense (Gb) and G. hirsutum (Gh), differ significantly in their fiber properties, the former having much longer, finer and stronger fibers that are highly prized. A better understanding of the genetics and underlying biological causes of these differences will aid further improvement of cotton quality through breeding and biotechnology. We evaluated an inter-specific Gh x Gb recombinant inbred line (RIL) population for fiber characteristics in 11 independent experiments under field and glasshouse conditions. Sites were located on 4 continents and 5 countries and some locations were analyzed over multiple years.
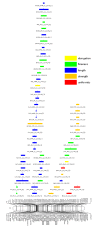
Results: The RIL population displayed a large variability for all major fiber traits. QTL analyses were performed on a per-site basis by composite interval mapping. Among the 651 putative QTLs (LOD > 2), 167 had a LOD exceeding permutation based thresholds. Coincidence in QTL location across data sets was assessed for the fiber trait categories strength, elongation, length, length uniformity, fineness/maturity, and color. A meta-analysis of more than a thousand putative QTLs was conducted with MetaQTL software to integrate QTL data from the RIL and 3 backcross populations (from the same parents) and to compare them with the literature. Although the global level of congruence across experiments and populations was generally moderate, the QTL clustering was possible for 30 trait x chromosome combinations (5 traits in 19 different chromosomes) where an effective co-localization of unidirectional (similar sign of additivity) QTLs from at least 5 different data sets was observed. Most consistent meta-clusters were identified for fiber color on chromosomes c6, c8 and c25, fineness on c15, and fiber length on c3.
Conclusions: Meta-analysis provided a reliable means of integrating phenotypic and genetic mapping data across multiple populations and environments for complex fiber traits. The consistent chromosomal regions contributing to fiber quality traits constitute good candidates for the further dissection of the genetic and genomic factors underlying important fiber characteristics, and for marker-assisted selection.
Figures


Similar articles
-
Identification of stable quantitative trait loci (QTLs) for fiber quality traits across multiple environments in Gossypium hirsutum recombinant inbred line population.BMC Genomics. 2016 Mar 8;17:197. doi: 10.1186/s12864-016-2560-2. BMC Genomics. 2016. PMID: 26951621 Free PMC article.
-
Mapping quantitative trait loci for lint yield and fiber quality across environments in a Gossypium hirsutum × Gossypium barbadense backcross inbred line population.Theor Appl Genet. 2013 Jan;126(1):275-87. doi: 10.1007/s00122-012-1980-x. Epub 2012 Oct 12. Theor Appl Genet. 2013. PMID: 23064252
-
High-density linkage map construction and QTL analyses for fiber quality, yield and morphological traits using CottonSNP63K array in upland cotton (Gossypium hirsutum L.).BMC Genomics. 2019 Nov 21;20(1):889. doi: 10.1186/s12864-019-6214-z. BMC Genomics. 2019. PMID: 31771502 Free PMC article.
-
Inheritance, QTLs, and Candidate Genes of Lint Percentage in Upland Cotton.Front Genet. 2022 Mar 31;13:855574. doi: 10.3389/fgene.2022.855574. eCollection 2022. Front Genet. 2022. PMID: 35450216 Free PMC article. Review.
-
Genetic Diversity, QTL Mapping, and Marker-Assisted Selection Technology in Cotton (Gossypium spp.).Front Plant Sci. 2021 Dec 16;12:779386. doi: 10.3389/fpls.2021.779386. eCollection 2021. Front Plant Sci. 2021. PMID: 34975965 Free PMC article. Review.
Cited by
-
Genetic Analysis of the Transition from Wild to Domesticated Cotton (Gossypium hirsutum L.).G3 (Bethesda). 2020 Feb 6;10(2):731-754. doi: 10.1534/g3.119.400909. G3 (Bethesda). 2020. PMID: 31843806 Free PMC article.
-
Isolation, characterization and mapping of genes differentially expressed during fibre development between Gossypium hirsutum and G. barbadense by cDNA-SRAP.J Genet. 2013;92(2):175-81. J Genet. 2013. PMID: 23970073
-
Evaluation of genomic selection methods for predicting fiber quality traits in Upland cotton.Mol Genet Genomics. 2020 Jan;295(1):67-79. doi: 10.1007/s00438-019-01599-z. Epub 2019 Aug 31. Mol Genet Genomics. 2020. PMID: 31473809
-
Quantitative trait loci analysis of fiber quality traits using a random-mated recombinant inbred population in Upland cotton (Gossypium hirsutum L.).BMC Genomics. 2014 May 24;15(1):397. doi: 10.1186/1471-2164-15-397. BMC Genomics. 2014. PMID: 24886099 Free PMC article.
-
Genetic and phenotypic effects of chromosome segments introgressed from Gossypium barbadense into Gossypium hirsutum.PLoS One. 2017 Sep 20;12(9):e0184882. doi: 10.1371/journal.pone.0184882. eCollection 2017. PLoS One. 2017. PMID: 28931074 Free PMC article.
References
-
- Wendel JF, Cronn RC. Polyploidy and the evolutionary history of cotton. Adv Agronomy. 2003;78:140–186.
-
- Meredith W. In: Use of Plant Introductions in Cultivar Development Part I. Shands HL, editor. Vol. 17. Madison: CSSA; 1991. Contributions of introductions to cotton improvement; pp. 127–146.
-
- Paterson AH, Smith R. In: Cotton Origin history, technology, and production. Smith CW, Cothren JT, editor. New York: John Wiley & Sons, Inc; 1999. Future horizons: Biotechnology for cotton improvement; pp. 415–432.
-
- Basra AS, Malik CP. Development of the cotton fiber. Int Rev Cytol. 1984;89:65–113. full_text.
-
- May LO. In: Cotton fibers. Basra AS, editor. Binghampton, NY: Food Products Press; 1999. Genetic variation in fiber quality; pp. 183–229.
Publication types
MeSH terms
LinkOut - more resources
Full Text Sources
Miscellaneous

