

Identifying differentially regulated subnetworks from phosphoproteomic data
- PMID: 20584295
- PMCID: PMC2914729
- DOI: 10.1186/1471-2105-11-351
Identifying differentially regulated subnetworks from phosphoproteomic data
Abstract
Background: Various high throughput methods are available for detecting regulations at the level of transcription, translation or posttranslation (e.g. phosphorylation). Integrating these data with protein networks should make it possible to identify subnetworks that are significantly regulated. Furthermore, such integration can support identification of regulated entities from often noisy high throughput data. In particular, processing mass spectrometry-based phosphoproteomic data in this manner may expose signal transduction pathways and, in the case of experiments with drug-treated cells, reveal the drug's mode of action.
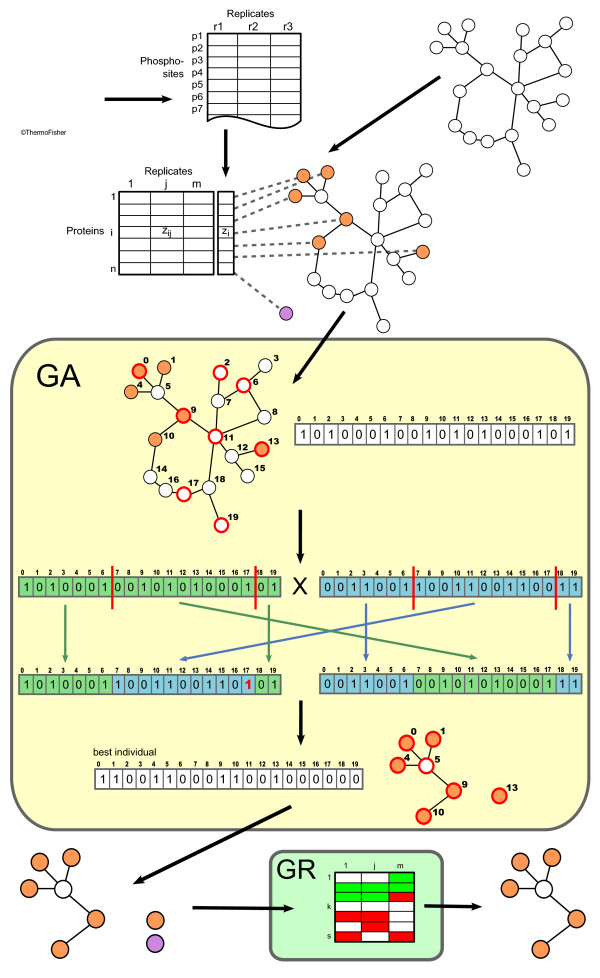
Results: Here, we introduce SubExtractor, an algorithm that combines phosphoproteomic data with protein network information from STRING to identify differentially regulated subnetworks and individual proteins. The method is based on a Bayesian probabilistic model combined with a genetic algorithm and rigorous significance testing. The Bayesian model accounts for information about both differential regulation and network topology. The method was tested with artificial data and subsequently applied to a comprehensive phosphoproteomics study investigating the mode of action of sorafenib, a small molecule kinase inhibitor.
Conclusions: SubExtractor reliably identifies differentially regulated subnetworks from phosphoproteomic data by integrating protein networks. The method can also be applied to gene or protein expression data.
Figures
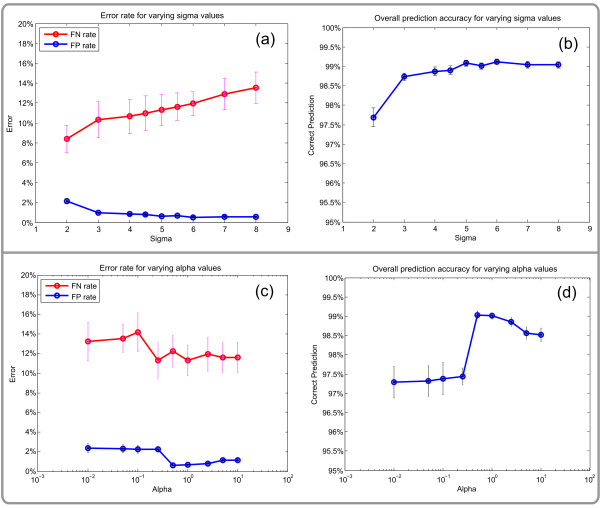
 , the FP rate as
  The overall prediction accuracy is
  . Error bars display the standard error of the mean over the ten generated data sets.
Similar articles
-
Integrating proteomic and phosphoproteomic data for pathway analysis in breast cancer.BMC Syst Biol. 2018 Dec 21;12(Suppl 8):130. doi: 10.1186/s12918-018-0646-y. BMC Syst Biol. 2018. PMID: 30577793 Free PMC article.
-
Identification of differentially expressed subnetworks based on multivariate ANOVA.BMC Bioinformatics. 2009 Apr 30;10:128. doi: 10.1186/1471-2105-10-128. BMC Bioinformatics. 2009. PMID: 19405941 Free PMC article.
-
Discovering regulatory and signalling circuits in molecular interaction networks.Bioinformatics. 2002;18 Suppl 1:S233-40. doi: 10.1093/bioinformatics/18.suppl_1.s233. Bioinformatics. 2002. PMID: 12169552
-
Quantitative phosphoproteomics strategies for understanding protein kinase-mediated signal transduction pathways.Expert Rev Proteomics. 2011 Feb;8(1):81-94. doi: 10.1586/epr.10.104. Expert Rev Proteomics. 2011. PMID: 21329429 Review.
-
Phosphoproteomics and molecular cardiology: techniques, applications and challenges.J Mol Cell Cardiol. 2012 Sep;53(3):354-68. doi: 10.1016/j.yjmcc.2012.06.001. Epub 2012 Jun 9. J Mol Cell Cardiol. 2012. PMID: 22691689 Review.
Cited by
-
Phosphosignature predicts dasatinib response in non-small cell lung cancer.Mol Cell Proteomics. 2012 Sep;11(9):651-68. doi: 10.1074/mcp.M111.016410. Epub 2012 May 21. Mol Cell Proteomics. 2012. PMID: 22617229 Free PMC article.
-
Quantitative Phosphoproteomics Analysis of ERBB3/ERBB4 Signaling.PLoS One. 2016 Jan 8;11(1):e0146100. doi: 10.1371/journal.pone.0146100. eCollection 2016. PLoS One. 2016. PMID: 26745281 Free PMC article.
-
Transcriptomic Module Discovery of Diarrhea-Predominant Irritable Bowel Syndrome: A Causal Network Inference Approach.Int J Mol Sci. 2024 Aug 28;25(17):9322. doi: 10.3390/ijms25179322. Int J Mol Sci. 2024. PMID: 39273274 Free PMC article.
-
Molecular mechanism and potential target indication of TAK-931, a novel CDC7-selective inhibitor.Sci Adv. 2019 May 22;5(5):eaav3660. doi: 10.1126/sciadv.aav3660. eCollection 2019 May. Sci Adv. 2019. PMID: 31131319 Free PMC article.
-
Detecting modules in biological networks by edge weight clustering and entropy significance.Front Genet. 2015 Aug 27;6:265. doi: 10.3389/fgene.2015.00265. eCollection 2015. Front Genet. 2015. PMID: 26379697 Free PMC article.
References
-
- Hutter B, Schaab C, Albrecht S, Borgmann M, Brunner NA, Freiberg C, Ziegelbauer K, Rock CO, Ivanov I, Loferer H. Prediction of mechanisms of action of antibacterial compounds by gene expression profiling. Antimicrob Agents Chemother. 2004;48:2838–2844. doi: 10.1128/AAC.48.8.2838-2844.2004. - DOI - PMC - PubMed
Publication types
MeSH terms
LinkOut - more resources
Full Text Sources
Other Literature Sources
