

Comparison of the chloroplast peroxidase system in the chlorophyte Chlamydomonas reinhardtii, the bryophyte Physcomitrella patens, the lycophyte Selaginella moellendorffii and the seed plant Arabidopsis thaliana
- PMID: 20584316
- PMCID: PMC3095285
- DOI: 10.1186/1471-2229-10-133
Comparison of the chloroplast peroxidase system in the chlorophyte Chlamydomonas reinhardtii, the bryophyte Physcomitrella patens, the lycophyte Selaginella moellendorffii and the seed plant Arabidopsis thaliana
Abstract
Background: Oxygenic photosynthesis is accompanied by the formation of reactive oxygen species (ROS), which damage proteins, lipids, DNA and finally limit plant yield. The enzymes of the chloroplast antioxidant system are exclusively nuclear encoded. During evolution, plastid and mitochondrial genes were post-endosymbiotically transferred to the nucleus, adapted for eukaryotic gene expression and post-translational protein targeting and supplemented with genes of eukaryotic origin.
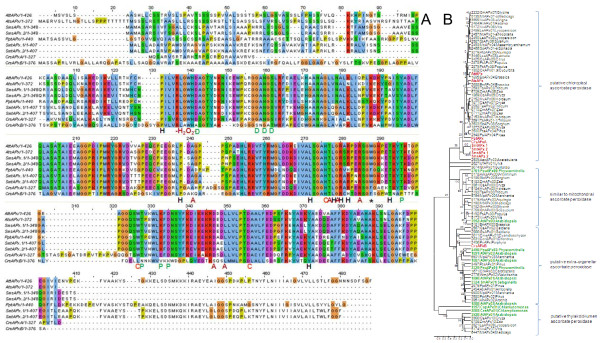
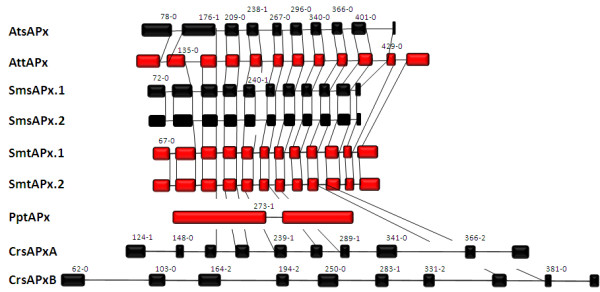
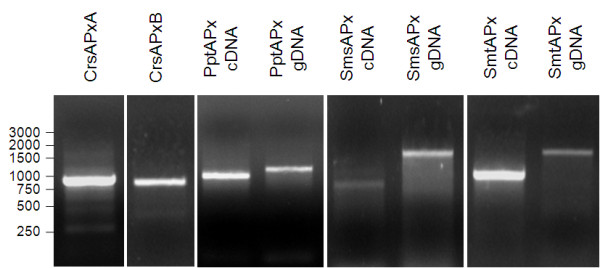
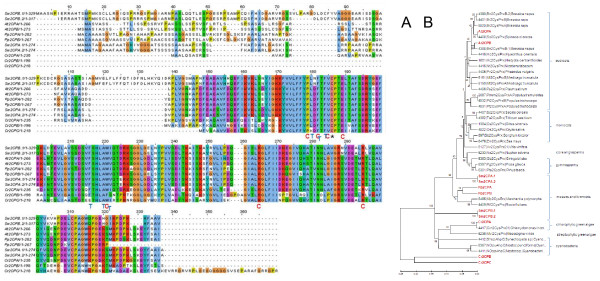
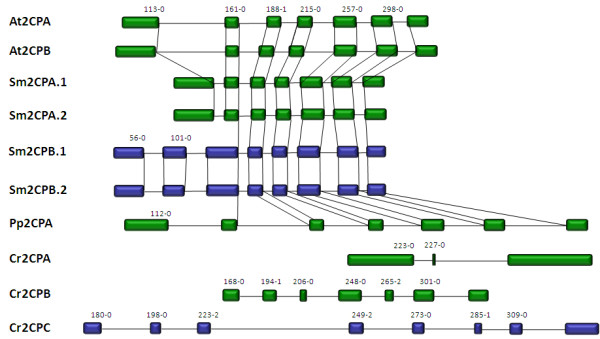
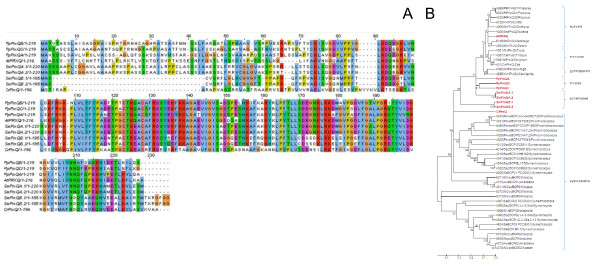
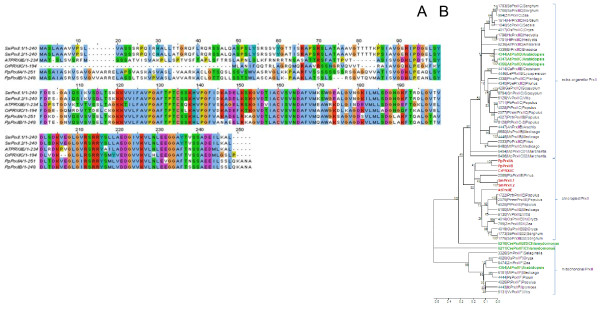
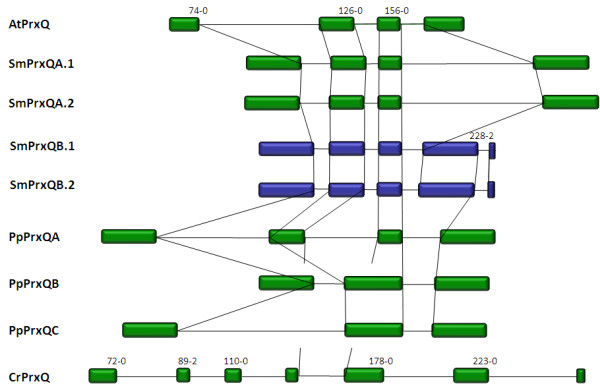
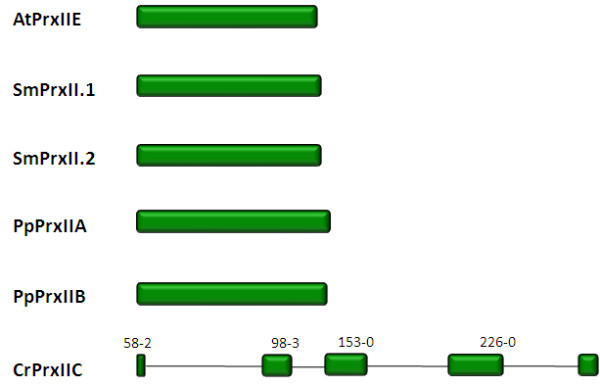
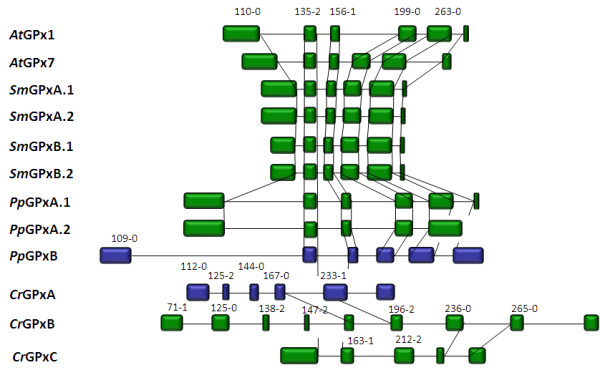
Results: Here, the genomes of the green alga Chlamydomonas reinhardtii, the moss Physcomitrella patens, the lycophyte Selaginella moellendorffii and the seed plant Arabidopsis thaliana were screened for ORFs encoding chloroplast peroxidases. The identified genes were compared for their amino acid sequence similarities and gene structures. Stromal and thylakoid-bound ascorbate peroxidases (APx) share common splice sites demonstrating that they evolved from a common ancestral gene. In contrast to most cormophytes, our results predict that chloroplast APx activity is restricted to the stroma in Chlamydomonas and to thylakoids in Physcomitrella. The moss gene is of retrotransposonal origin.The exon-intron-structures of 2CP genes differ between chlorophytes and streptophytes indicating an independent evolution. According to amino acid sequence characteristics only the A-isoform of Chlamydomonas 2CP may be functionally equivalent to streptophyte 2CP, while the weakly expressed B- and C-isoforms show chlorophyte specific surfaces and amino acid sequence characteristics. The amino acid sequences of chloroplast PrxII are widely conserved between the investigated species. In the analyzed streptophytes, the genes are unspliced, but accumulated four introns in Chlamydomonas. A conserved splice site indicates also a common origin of chlorobiont PrxQ.The similarity of splice sites also demonstrates that streptophyte glutathione peroxidases (GPx) are of common origin. Besides a less related cysteine-type GPx, Chlamydomonas encodes two selenocysteine-type GPx. The latter were lost prior or during streptophyte evolution.
Conclusion: Throughout plant evolution, there was a strong selective pressure on maintaining the activity of all three investigated types of peroxidases in chloroplasts. APx evolved from a gene, which dates back to times before differentiation of chlorobionts into chlorophytes and streptophytes, while Prx and presumably also GPx gene patterns may have evolved independently in the streptophyte and chlorophyte branches.
Figures
Similar articles
-
Specificity versus redundancy in the RAP2.4 transcription factor family of Arabidopsis thaliana: transcriptional regulation of genes for chloroplast peroxidases.BMC Plant Biol. 2017 Aug 23;17(1):144. doi: 10.1186/s12870-017-1092-5. BMC Plant Biol. 2017. PMID: 28835225 Free PMC article.
-
The peroxiredoxin and glutathione peroxidase families in Chlamydomonas reinhardtii.Genetics. 2008 May;179(1):41-57. doi: 10.1534/genetics.107.086041. Genetics. 2008. PMID: 18493039 Free PMC article. Review.
-
Evolution of phage-type RNA polymerases in higher plants: characterization of the single phage-type RNA polymerase gene from Selaginella moellendorffii.J Mol Evol. 2009 May;68(5):528-38. doi: 10.1007/s00239-009-9229-2. Epub 2009 May 1. J Mol Evol. 2009. PMID: 19407923
-
From sequence analysis of three novel ascorbate peroxidases from Arabidopsis thaliana to structure, function and evolution of seven types of ascorbate peroxidase.Biochem J. 1997 Sep 1;326 ( Pt 2)(Pt 2):305-10. doi: 10.1042/bj3260305. Biochem J. 1997. PMID: 9291097 Free PMC article.
-
Chloroplastic ascorbate peroxidases targeted to stroma or thylakoid membrane: The chicken or egg dilemma.FEBS Lett. 2022 Dec;596(23):2989-3004. doi: 10.1002/1873-3468.14438. Epub 2022 Aug 19. FEBS Lett. 2022. PMID: 35776057 Review.
Cited by
-
Cyclic electron flow (CEF) and ascorbate pathway activity provide constitutive photoprotection for the photopsychrophile, Chlamydomonas sp. UWO 241 (renamed Chlamydomonas priscuii).Photosynth Res. 2022 Mar;151(3):235-250. doi: 10.1007/s11120-021-00877-5. Epub 2021 Oct 5. Photosynth Res. 2022. PMID: 34609708
-
Synonymous codon usage bias in plant mitochondrial genes is associated with intron number and mirrors species evolution.PLoS One. 2015 Jun 25;10(6):e0131508. doi: 10.1371/journal.pone.0131508. eCollection 2015. PLoS One. 2015. PMID: 26110418 Free PMC article.
-
Reannotation and extended community resources for the genome of the non-seed plant Physcomitrella patens provide insights into the evolution of plant gene structures and functions.BMC Genomics. 2013 Jul 23;14:498. doi: 10.1186/1471-2164-14-498. BMC Genomics. 2013. PMID: 23879659 Free PMC article.
-
Comparative analysis of ascorbate peroxidases (APXs) from selected plants with a special focus on Oryza sativa employing public databases.PLoS One. 2019 Dec 19;14(12):e0226543. doi: 10.1371/journal.pone.0226543. eCollection 2019. PLoS One. 2019. PMID: 31856232 Free PMC article.
-
Polyploidization is accompanied by synonymous codon usage bias in the chloroplast genomes of both cotton and wheat.PLoS One. 2020 Nov 19;15(11):e0242624. doi: 10.1371/journal.pone.0242624. eCollection 2020. PLoS One. 2020. PMID: 33211753 Free PMC article.
References
-
- Baier M, Dietz K-J. The costs and benefits of oxygen for photosynthesizing plant cells. Progress in Botany. 1999;60:282–314.
-
- Asada K. In: Causes of photooxidative stress and amelioration of defense systems in plants. Foyer CH, Mullineaux PM, editor. Boca Raton, Ann Arbor, London, Tokyo: CRC Press; 1994. Production and action of active oxygen species in photosynthetic tissues; pp. 78–104.
-
- Navrot N, Collin V, Gualberto J, Gelhaye E, Hirasawa M, Rey P, Knaff DB, Issakidis E, Jacquot JP, Routhier N. Plant glutathione peroxidases are functional peroxiredoxins distributed in several subcellular compartments and regulated during biotic and abiotic stresses. Plant Physiol. 2006;142:1364–1379. doi: 10.1104/pp.106.089458. - DOI - PMC - PubMed
Publication types
MeSH terms
Substances
LinkOut - more resources
Full Text Sources
Molecular Biology Databases
Research Materials
Miscellaneous
