

doi: 10.1186/gb-2010-11-6-r69.
Epub 2010 Jun 28.
Estimating enrichment of repetitive elements from high-throughput sequence data
Affiliations
- PMID: 20584328
- PMCID: PMC2911117
- DOI: 10.1186/gb-2010-11-6-r69
Item in Clipboard
Estimating enrichment of repetitive elements from high-throughput sequence data
Genome Biol.
2010.
Abstract
We describe computational methods for analysis of repetitive elements from short-read sequencing data, and apply them to study histone modifications associated with the repetitive elements in human and mouse cells. Our results demonstrate that while accurate enrichment estimates can be obtained for individual repeat types and small sets of repeat instances, there are distinct combinatorial patterns of chromatin marks associated with major annotated repeat families, including H3K27me3/H3K9me3 differences among the endogenous retroviral element classes.
Figures
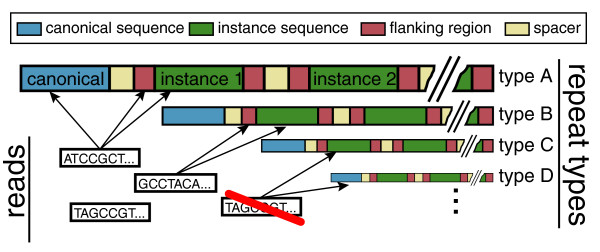
Aggregating reads for repeat type enrichment estimation. To increase the accuracy, the enrichment estimate combines reads mapping to the canonical repeat sequence and reads mapping to the body or boundaries of the repeat instances incorporated into the genome assembly. The calculation utilizes reads that align to multiple positions in the genome, if all such positions belong to the instances of the same repeat type. Reads aligning to more than one repeat type are excluded.
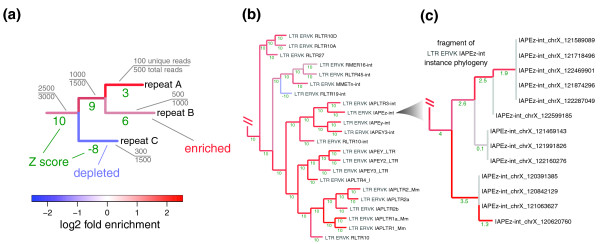
Phylogenetic analysis of repeat enrichment patterns. (a) Aiming to provide most informative estimates of repeat enrichment that can be attained for a given dataset, repeats are organized into a phylogenetic tree on the basis of read set similarity to maximize the number of uniquely assignable reads that can be used for enrichment estimation. The estimates are illustrated on the resulting tree branches using colors. The nodes of the tree represent sets of repetitive sequences. The gray labels show the fraction of total number of ChIP reads that map to a given set of sequences (node) that can be associated uniquely. The tree is constructed in a way that maximizes the number of additional uniquely associated reads gained at each step. For instance, considering repeats A and B together allows 1,000 uniquely associated ChIP reads to be to utilized for enrichment estimation, even though the sum of the reads uniquely associated with repeat A and repeat B separately is 600. The 400 additional reads are those that map to both A and B repeats, but do not map to any other repeats (in the same way the discarded read in Figure 1 maps to both C and D). The length of each branch corresponds to the number of the unique reads gained using a log scale when collapsing sequences of the descendant nodes into a single set. The statistical significance of the observed enrichment or depletion is shown as a Z-score (green numbers). Large positive Z-score values denote statistically significant enrichment (Z-score of 3.1 corresponds to a P-value of 10-3), and negative values correspond to significant depletion. The Z-score magnitude is capped at 10. (b) A fragment of the enrichment phylogeny of the Repbase repeat types for H3K9me3 enrichment in mES cells. The example illustrates grouping of repeats from ERV-K class, all of which, with the exception of RLTR19-int, are highly enriched for the H3K9me3 modification. Additional examples are shown in Figure S4 of Additional file 1. (c) A small fragment of H3K9me3 enrichment phylogeny for the individual instances of the intracisternal A particle (IAP) interspersed repeats (IAPEz-int). The fragment clusters instances located within a specific region on chromosome X due to a high degree of sequence identity between them. While the lack of discriminating sequences precludes evaluation of each instance individually, considering nearly identical instances together allows the demonstration of statistically significant enrichment of this localized group of instances or the H3K9me3 mark in mES cells. LTR, long terminal repeat.
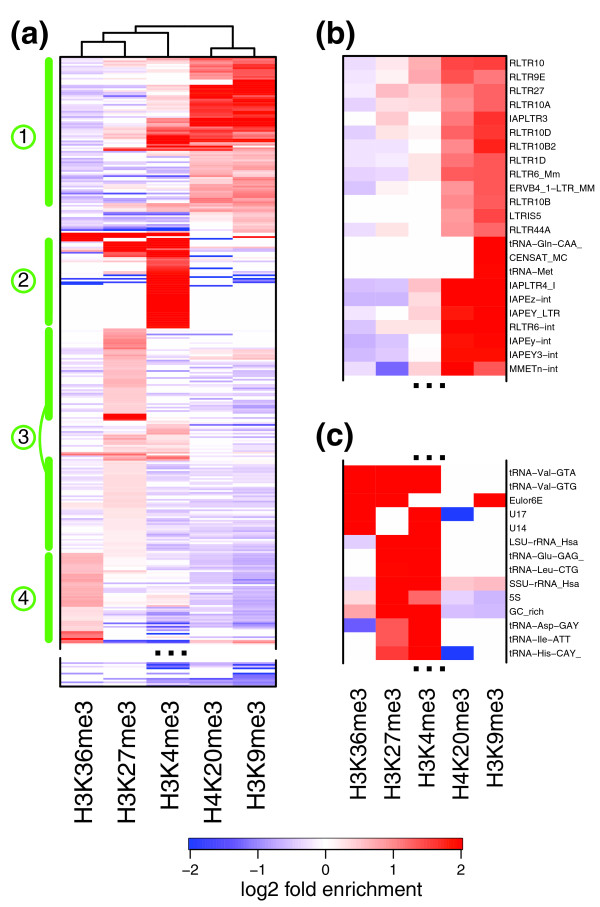
Repeat enrichment patterns in mouse cell lines. (a) Combinatorial patterns of repeat enrichment in mES cells. The repeat types (rows) were clustered according to the MLE enrichment in different marks (disregarding depletion; see Materials and methods), with red colors corresponding to enrichment, and blue colors corresponding to depletion. Repeat types that do not show statistically significant enrichment or depletion are shown in white. Prominent sets of repeat types are highlighted on the left-hand side (1 to 4; see text). The bottom part of the plot is omitted as it contains repeats devoid of enrichment in any examined modifications. See Figure S5 in Additional file 1 for a complete, magnified view showing all the repeat type labels. (b) An enlarged view of a portion of set 1, illustrating ERV1/ERV-K repeats enriched for H3K9me3 and H4K20me3. (c) A portion of set 2 showing enrichment for H3K4me3 and H3K27me3 at tRNA repeats.
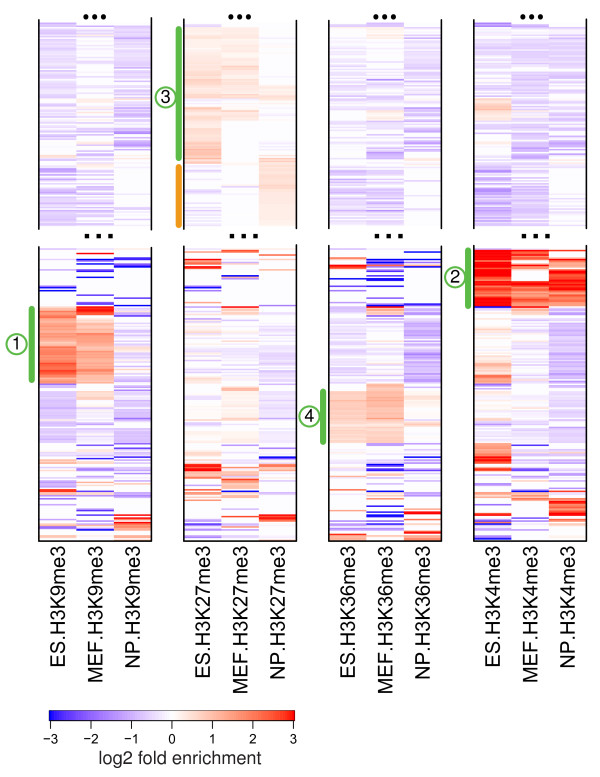
Comparison of histone modification profiles in mES, neuronal progenitor and mouse embryonic fibroblast cells. The repeat types were clustered based on their enrichment profiles across four different histone marks in three cells, so that the order of repeat types is the same for each histone methylation mark shown. Green bars mark major clusters of enrichment, with numbers corresponding to mES clusters from Figure 3a. The orange bar marks a set of repeats, composed predominantly of LTRs, that acquires H3K27me3 in NP cells. See Figure S7 in Additional file 1 for a complete plot.
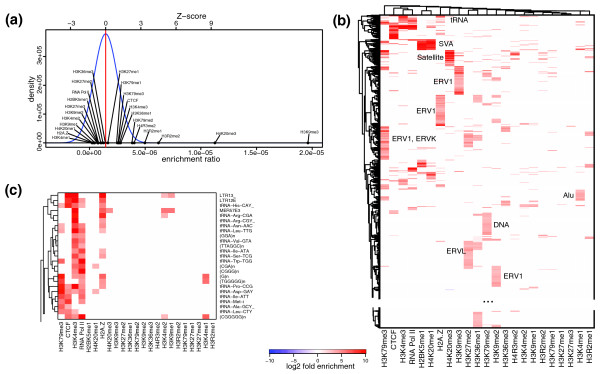
Repeat enrichment patterns in human CD4+ T cells. (a) To normalize read counts in the absence of input sequencing data, the enrichment values were estimated relative to other marks using distributions of enrichment coefficients observed for each repeat type (see Materials and methods). The plot shows enrichment coefficients for various chromatin marks for the HSAT6 repeat. H3K9me3 and H4K20me3 deviate from the nominal levels exhibited by most of the marks in a statistically significant way. (b) Similar to Figure 3a, the repeat types were clustered according to their combined enrichment estimates across measured chromatin marks. Part of the plot containing no enrichment clusters is omitted (see Figure S9 in Additional file 1 for a complete plot). Repeat families over-abundant within major clusters are labeled on the plot. (c) Enlarged view of the tRNA-dominated cluster located at the top of the plot shown in (b).
References
-
- Chen X, Xu H, Yuan P, Fang F, Huss M, Vega VB, Wong E, Orlov YL, Zhang W, Jiang J, Loh YH, Yeo HC, Yeo ZX, Narang V, Govindarajan KR, Leong B, Shahab A, Ruan Y, Bourque G, Sung WK, Clarke ND, Wei CL, Ng HH. Integration of external signaling pathways with the core transcriptional network in embryonic stem cells. Cell. 2008;133:1106–1117. doi: 10.1016/j.cell.2008.04.043. - DOI - PubMed
-
- Mikkelsen TS, Ku M, Jaffe DB, Issac B, Lieberman E, Giannoukos G, Alvarez P, Brockman W, Kim TK, Koche RP, Lee W, Mendenhall E, O'Donovan A, Presser A, Russ C, Xie X, Meissner A, Wernig M, Jaenisch R, Nusbaum C, Lander ES, Bernstein BE. Genome-wide maps of chromatin state in pluripotent and lineage-committed cells. Nature. 2007;448:553–560. doi: 10.1038/nature06008. - DOI - PMC - PubMed
-
- Birney E, Stamatoyannopoulos JA, Dutta A, Guigo R, Gingeras TR, Margulies EH, Weng Z, Snyder M, Dermitzakis ET, Thurman RE, Kuehn MS, Taylor CM, Neph S, Koch CM, Asthana S, Malhotra A, Adzhubei I, Greenbaum JA, Andrews RM, Flicek P, Boyle PJ, Cao H, Carter NP, Clelland GK, Davis S, Day N, Dhami P, Dillon SC, Dorschner MO, Fiegler H. Identification and analysis of functional elements in 1% of the human genome by the ENCODE pilot project. Nature. 2007;447:799–816. doi: 10.1038/nature05874. - DOI - PMC - PubMed
MeSH terms
Substances
LinkOut - more resources
Full Text Sources
Other Literature Sources
