. 2010 Sep 3;285(36):28322-32.
doi: 10.1074/jbc.M110.116392. Epub 2010 Jun 28.

Isoform-specific prolongation of Kv7 (KCNQ) potassium channel opening mediated by new molecular determinants for drug-channel interactions

Affiliations

Isoform-specific prolongation of Kv7 (KCNQ) potassium channel opening mediated by new molecular determinants for drug-channel interactions

Zhaobing Gao et al. J Biol Chem. .

Abstract

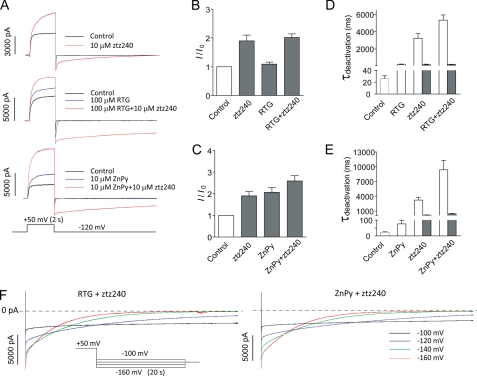
Kv7 channels, especially Kv7.2 (KCNQ2) and Kv7.3 (KCNQ3), are key determinants for membrane excitability in the brain. Some chemical modulators of KCNQ channels are in development for use as anti-epileptic drugs, such as retigabine (D-23129, N-(2-amino-4-(4-fluorobenzylamino)-phenyl)), which was recently approved for clinical use. In addition, several other compounds were also reported to potentiate activity of the Kv7 channels. It is therefore of interest to investigate compound-channel interactions, so that more insights may be gained to aid future development of therapeutics. We have conducted a screen of 20,000 compounds for KCNQ2 potentiators using rubidium flux combined with atomic absorption spectrometry. Here, we report the characterization of a series of new structures that display isoform specificity and induce a marked reduction of deactivation distinct from that of retigabine. Furthermore, KCNQ2(W236L), a previously reported mutation that abolishes sensitivity to retigabine, remains fully sensitive to these compounds. This result, together with mutagenesis and other studies, suggests that the reported compounds confer a unique mode of action and involve new molecular determinants on the channel protein, consistent with the idea of recognizing a new site on channel protein.


Figures

REACTION 1
REACTION 1
FIGURE 1.
FIGURE 1.
Structures of primary screen hits and derivatives. A, a series of initial hits identified from the ChemBridge Diverset compound collection, with ChemBridge ID number as indicated. B, derivatives of nitrogen position and ring placements (X, Y = F, Cl, Br; n = 0, 1, 2). C, structures of ztz240 and ICA-27243 (ztz233; see Figs. 8 and 9).
FIGURE 2.
FIGURE 2.
ztz240 activation on KCNQ2 channels. A, the representative traces of KCNQ2, before and after application of 10 μm ztz240, elicited by the protocol as indicated. The holding potential is −80 mV, followed by a series of depolarization steps from −70 to +50 mV in 10-mV increments, followed by an 800-ms hypopolarization step to −120 mV to record the tail current. B, the representative traces of KCNQ2, with and without 10 μm ztz240, elicited by a modified protocol from A, as indicated. The holding potential was −120 mV. C, dose-response curve of ztz240 effects on outward current of KCNQ2 channels. The ratio of outward current amplitude in the presence of the compound (I) versus that in the absence of compound (I0) was plotted against compound concentration. The outward currents were elicited by a 2-s depolarization to +50 mV from the holding potential, −120 mV. D, voltage activation curves of KCNQ2, in the absence or presence of 10 μm ztz240. Error bars, S.E.
FIGURE 3.
FIGURE 3.
Effects on deactivation by ztz240 on KCNQ2. A, comparison of 10 μm ztz240, 10 μm ZnPy, and 10 μm retigabine (RTG) effects on KCNQ2, in the absence (black) and presence (gray) of drugs. The protocol is indicated at the bottom. B, histogram shows that ztz240 slows the deactivation of KCNQ2. The deactivation was fitted with a biexponential function with fast (τf) and slow (τs) components. C, the representative traces show deactivation phases of KCNQ2 channel in the absence (left) or presence of 10 μm ztz240 (right). The gray line indicates 0 pA (base line). The time scale and protocol used are as indicated. D, deactivation phase of KCNQ2 without drug was fitted by single exponential function, and the time constant (τ) was plotted against different voltages. E, deactivation of KCNQ2 after application of drug was fitted by biexponential function, and the time constants, both τf and τs, were plotted against different voltages, respectively. F, the normalized activation phases from the full traces (inset) in the control (black line) and after application of 10 μm ztz240 (gray line) are shown. The protocol in A was used. G, the activation phases in the absence or presence of ztz240 were fitted to a biexponential function, and the time constants (τf and τs) were plotted against different testing voltages. H, the dose-response relationship of ztz240 concentration to slow time constant of deactivation (τs). The protocol in A was used. Error bars, S.E.
FIGURE 4.
FIGURE 4.
The subtype specificity of ztz240 on KCNQ channels. A, whole cell currents of CHO cells transfected individually with the indicated cDNAs were recorded in the absence (left) and presence (right) of 10 μm ztz240. B, histogram shows 10 μm ztz240 potentiation on KCNQ1 to KCNQ5. The normalized current amplitude is shown. C, the representative traces of mutants W236L, L245A, L279A, and L245A/L279A in the absence (black) and presence (gray) of 10 μm ztz240 (left) and corresponding activation curves (right). The representative traces of the mutants were elicited by depolarization to +50 mV from the holding potential at −120 mV. Error bars, S.E.
FIGURE 5.
FIGURE 5.
Non-additive effects on KCNQ2 channel using mixed active compounds. A, representative traces in the absence or presence of drugs are shown as indicated and color-coded. B and C, histograms represent increase in outward current amplitude (I/I0) in the absence or presence of drugs as indicated. D and E, histograms represent time constants of deactivation in the absence or presence of drugs as indicated. For controls, RTG and ZnPy, the unfilled bars indicate the time constant revealed by single exponential equation fitting. For ztz240 alone or ztz240 mixed with RTG or ZnPy, the deactivation could optimally be fitted with an exponential equation of two components: fast (filled bars) and slow (unfilled bars) time constants (also see Fig. 3E). F, representative traces in the presence of RTG + ztz240 (left) and ZnPy + ztz240 (right) elicited by the protocol as indicated. The voltage steps are color-coded as indicated. The dotted lines represent the base line of no current. Error bars, S.E.
FIGURE 6.
FIGURE 6.
Point mutations revealed the critical residue for ztz240 activity. A, the currents of wild type KCNQ2 and the indicated mutants in the absence or presence of 10 μm ztz240, 10 μm RTG, and 10 μm ZnPy, respectively. The S6 sequence of KCNQ2 is shown in the inset, and two hinges are highlighted in boldface type. B, histogram comparing outward current potentiation of A309C, A309V, and A309G with ztz240. C, histogram comparing deactivation of A309C, A309V, and A309G. Error bars, S.E.
FIGURE 7.
FIGURE 7.
The derivatives of ztz240 activate KCNQ2 channels. A, chemical structure of derivatives of ztz240 and six other derivatives. B, heat map of Tl+ flux assay (F/F0) for the derivatives in duplicate. The Tl+ flux assay is detailed under “Experimental Procedures.” Columns 1 and 2 show controls (buffer, Tl+ stimulus solutions, retigabine, ZnPy, and 5337031) for KCNQ2-HEK293 cells, and columns 23 and 24 show controls (buffer, Tl+ stimulus solutions, retigabine, ZnPy, and 5337031) for wild-type HEK293 cells. C, scatter plot Tl+ flux assay for the derivatives in two concentrations (2 and 20 μm). Black, not active in both concentrations; green, active only in high concentration (20 μm); blue, active in both concentrations. F0 and F, fluorescence before and after compound addition, respectively. D, histograms of whole cell patch clamp currents in the presence of the indicated compounds at 10 μm. Error bars, S.E.
FIGURE 8.
FIGURE 8.
The roles of fluorine, chlorine, or bromine substitutions in KCNQ activation and deactivation. The chemical structure of the compounds, as indicated, and the corresponding representative traces in the absence (black) and presence (gray) of corresponding compounds are shown. The slow time constant (τs) (numbers in italic type) and shifting of V½ (numbers in normal type) of each compound are as indicated in the inset. For the recording protocol, see Fig. 3A.
FIGURE 9.
FIGURE 9.
The diagram shows the chlorine or bromine substitution is necessary for ztz240 activity on activation and deactivation of KCNQ2. The chemical structure of the compounds, as indicated, and the corresponding representative traces in the absence (black) and presence (gray) are shown beside the compound structure. The slow deactivation time constant (τs) (numbers in italic type) and shifting of V½ (numbers in normal type) of each compound are indicated in each inset. NA, not applicable (the compound did not cause two-phase deactivation). For the recording protocol, see Fig. 3A.
FIGURE 10.
FIGURE 10.
Comparison of ztz233 (ICA-27243) and ztz240 effects on KCNQ2/3 and KCNQ4. A and B, representative traces of ztz233 (ICA-27243) and ztz240 effects on KCNQ2/3 heteromultimers, under the same voltage steps as shown in Fig. 3A. C and D, G-V curve of ztz233 (ICA-27243) and ztz240 on KCNQ2/3 (n = 3–6). The same protocol for wild type KCNQ2 was used in Fig. 2B. E–H, dose-response curves of ztz233 (ICA-27243) and ztz240 on KCNQ2/3 and KCNQ4 as indicated (n = 4–10). Error bars, S.E.

Similar articles

Cited by

References

    1. Ashcroft F. M. (2006) Nature 440, 440–447 - PubMed
    1. Doyle D. A. (2004) Trends Neurosci. 27, 298–302 - PubMed
    1. Sigworth F. J. (1994) Q. Rev. Biophys. 27, 1–40 - PubMed
    1. Bezanilla F., Stefani E. (1994) Annu. Rev. Biophys. Biomol. Struct. 23, 819–846 - PubMed
    1. Horrigan F. T., Aldrich R. W. (2002) J. Gen. Physiol. 120, 267–305 - PMC - PubMed

Publication types