. 2010 Sep;54(9):3790-8.
doi: 10.1128/AAC.01783-09. Epub 2010 Jun 28.

Different classes of antibiotics differentially influence shiga toxin production

Affiliations

Different classes of antibiotics differentially influence shiga toxin production

Colleen Marie McGannon et al. Antimicrob Agents Chemother. 2010 Sep.

Abstract

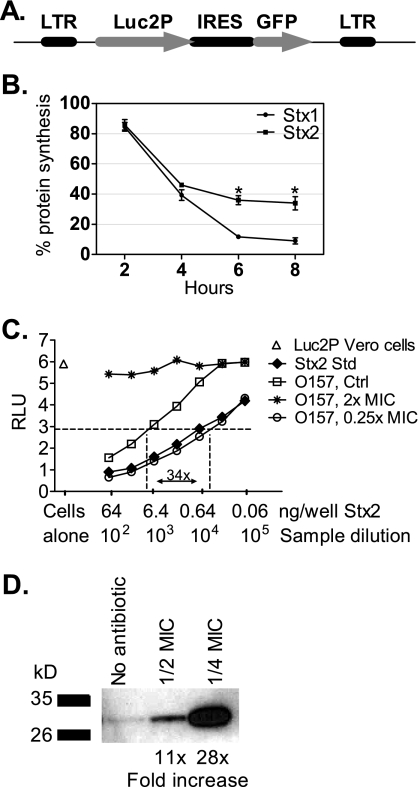
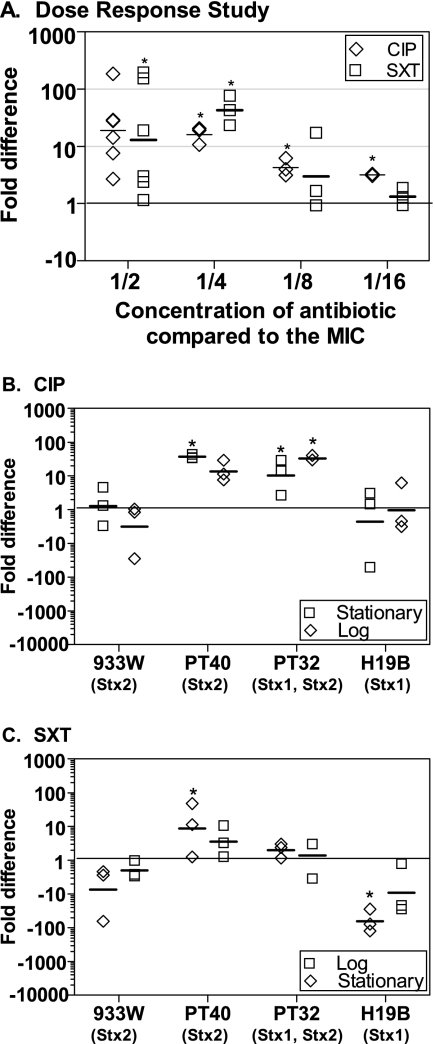
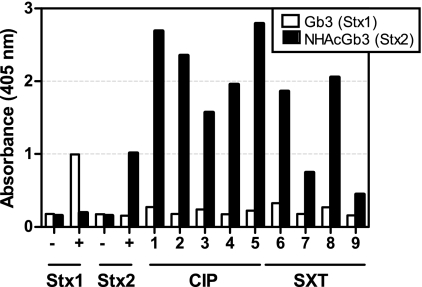
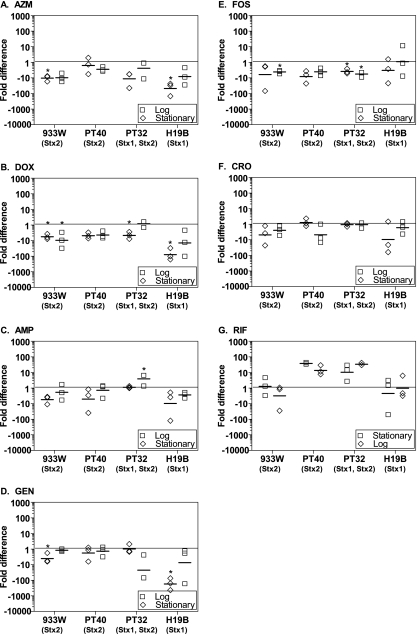
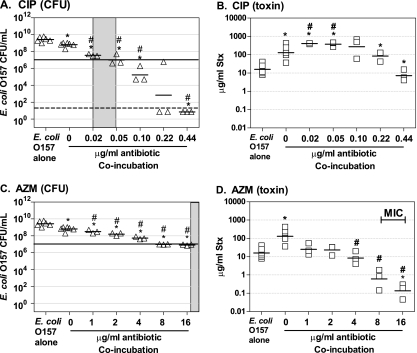
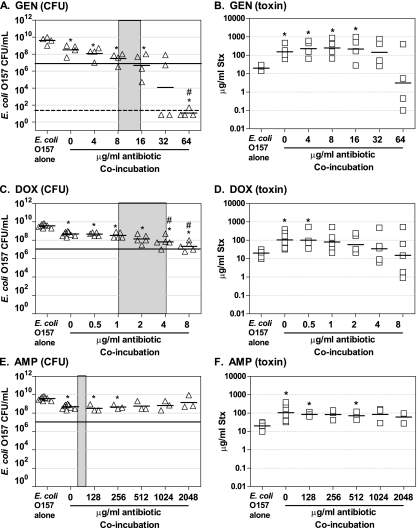
Shiga toxin (Stx) in Escherichia coli O157:H7 is encoded as a late gene product by temperate bacteriophage integrated into the chromosome. Phage late genes, including stx, are silent in the lysogenic state. However, stress signals, including some induced by antibiotics, trigger the phage to enter the lytic cycle, and phage replication and Stx production occur concurrently. In addition to the Stx produced by O157:H7, phage produced by O157:H7 can infect harmless intestinal E. coli and recruit them to produce Shiga toxin. To understand how antibiotics influence Stx production, Stx lysogens were treated with different classes of antibiotics in the presence or absence of phage-sensitive E. coli, and Stx-mediated inhibition of protein synthesis was monitored using luciferase-expressing Vero cells. Growth-inhibitory levels of antibiotics suppressed Stx production. Subinhibitory levels of antibiotics that target DNA synthesis, including ciprofloxacin (CIP) and trimethoprim-sulfamethoxazole, increased Stx production, while antibiotics that target the cell wall, transcription, or translation did not. More Stx was produced when E. coli O157:H7 was incubated in the presence of phage-sensitive E. coli than when grown as a pure culture. Remarkably, very high levels of Stx were detected even when growth of O157:H7 was completely suppressed by CIP. In contrast, azithromycin significantly reduced Stx levels even when O157:H7 viability remained high.


Figures

FIG. 1.
FIG. 1.
Luciferase assay for Stx. (A) The Luc2p-MigR1 retroviral vector with the gene for Luc2p cloned upstream of the internal ribosomal entry site (IRES) of the gene for enhanced GFP. (B) Luciferase activity of Luc2p Vero cells incubated with 0.6 ng of Stx1 or Stx2, assessed as a function of time. The results are the average of three trials. The statistical significance between Stx1 and Stx2 is indicated by an asterisk (P < 0.05, Student t test). (C) Luciferase activity of Luc2p Vero cells. The Stx2 standard (Std) contains 258 μg of Stx2/ml. The average for six wells of untreated Luc2p Vero cells was determined to be 5.8 RLU, and the level of 50% inhibition or ED50 (2.9 RLU) is indicated by the horizontal dashed line. (D) E. coli O157:H7, strain PT-40, was grown in the presence or absence (control) of SXT as indicated. Equal toxin loads (64 ng) based on the Luc2p Vero cell assay were resolved by electrophoresis on an 8 to 16% Tris-glycine gel and blotted with polyclonal antibody to Stx2. Signal relative to the no-antibiotic control was determined by using ImageQuant.
FIG. 2.
FIG. 2.
Effect of CIP and SXT on the production of Stx. The fold difference in toxin production compared to the no-antibiotic control was determined by using the luciferase assay. Each symbol represents one of three to six independent trials, and the horizontal dash denotes the geometric mean. Statistical significance (P < 0.05, Student unpaired t test with Welch's correction for unequal variance) compared to the no-antibiotic control is indicated by an asterisk. (A) Dose-response study. The O157:H7 strain PT-32 was incubated with subinhibitory concentrations of CIP or SXT. (B and C) Response of other strains to CIP (B) and SXT (C). E. coli strains inoculated in the stationary phase or the logarithmic phase were incubated overnight with CIP or SXT at 1/2 the MIC. In the absence of antibiotic, C600::933W, PT-32, and PT-40 produced between 8 and 27 μg of Stx/ml, whereas C600::H19B produced between 32 and 58 μg of Stx/ml.
FIG. 3.
FIG. 3.
PT-32(stx1 stx2) produces Stx2. E. coli O157:H7 strain PT-32 was grown in the presence of CIP (samples 1 to 5) or SXT (samples 6 to 9) at 1/2 the MIC, and binding to receptor-specific analogues for Stx1 (Gb3) or Stx2 (NHAcGb3) was assessed. Stx1 or Stx2 added at 1 μg was used as a positive control (+), and wells incubated without Stx but incubated with primary and secondary antibody (−) served as a negative control. Nearly identical results were obtained when this assay was repeated (data not shown).
FIG. 4.
FIG. 4.
Influence of antibiotics on Stx production in pure culture. E. coli strains inoculated in the stationary phase (□) or the logarithmic phase (⋄) were incubated overnight with the following antibiotics at 1/2 the MIC: azithromycin (A), doxycycline (B), ampicillin (C), gentamicin (D), fosfomicin (E), ceftiaxone (F), or rifampin (G). The fold difference in toxin production compared to the no-antibiotic control is plotted. Each symbol represents one of three independent trials, and the horizontal dash denotes the geometric mean. The statistical significance (P < 0.05, Student t test unpaired t test with Welch's correction for unequal variance) compared to the no-antibiotic control is indicated by an asterisk.
FIG. 5.
FIG. 5.
Influence of antibiotics on Stx production in coculture with antibiotic-sensitive, phage-susceptible E. coli. O157:H7 strain 185 was grown overnight in the presence of Stx-phage susceptible E. coli isolate (CMUC-170) susceptible to CIP (A and B) or AZM (C and D). Cultures were plated to determine the CFU (A and C), and Stx levels were determined by using the luciferase assay (B and D). Each symbol represents an independent trial, and the horizontal dash denotes the geometric mean. Controls (O157 alone and no-antibiotic coincubations) were repeated four to eight times, and all other coincubation experiments were repeated three to five times. Statistical significance (P < 0.05 Student unpaired t test with Welch's correction for unequal variance) compared to the pure culture of E. coli O157:H7 is denoted with an asterisk, and statistical significance compared to the no-antibiotic coculture control is denoted by a pound sign (#). The MIC for pure culture of E. coli O157:H7 is noted by a gray box. The horizontal line at 107 denotes the number of O157:H7 at the visual limit of detection. Samples with CFU/ml below the limit of detection (50 CFU/ml, which is represented by the dashed line) were incorporated into the statistical analysis using the square root of the limit of detection).
FIG. 6.
FIG. 6.
Influence of antibiotics on Stx production in coculture with antibiotic-resistant, phage-susceptible E. coli. E. coli O157:H7 strain 185 was grown overnight in the presence of Stx-phage susceptible E. coli isolate resistant to GEN (CMUC-170) (A and B), DOX (CMUC-172) (C and D), or AMP (CMUC-172) (E and F). Cultures were plated to determine CFU (A, C, and E) and Stx levels were determined by using the luciferase assay (B, D, and F), as described in Fig. 5. Each symbol represents an independent trial, and the horizontal dash denotes the geometric mean, Controls (O157 alone and no-antibiotic coincubations) were repeated four to eight times, and all other coincubation experiments were repeated three to five times. Statistical significance (P < 0.05 Student unpaired t test with Welch's correction for unequal variance) compared to the pure culture of E. coli O157:H7 is denoted by an asterisk, and statistical significance compared to the no-antibiotic coculture control is denoted with a pound sign. The MIC for pure culture of E. coli O157:H7 is noted by the gray box. The horizontal line at 107 denotes the number of O157:H7 at the visual limit of detection. Samples with CFU/ml below the limit of detection (50 CFU/ml, which is represented by the dashed line) were incorporated into the statistical analysis using the square root of the limit of detection).

Similar articles

Cited by

References

    1. Boerlin, P., S. Chen, J. K. Colbourne, R. Johnson, S. De Grandis, and C. Gyles. 1998. Evolution of enterohemorrhagic Escherichia coli hemolysin plasmids and the locus for enterocyte effacement in Shiga toxin-producing E. coli. Infect. Immun. 66:2553-2561. - PMC - PubMed
    1. Boerlin, P., S. A. McEwen, F. Boerlin-Petzold, J. B. Wilson, R. P. Johnson, and C. L. Gyles. 1999. Associations between virulence factors of Shiga toxin-producing Escherichia coli and disease in humans. J. Clin. Microbiol. 37:497-503. - PMC - PubMed
    1. Endo, Y., K. Tsurugi, T. Yutsudo, Y. Takeda, T. Ogasawara, and K. Igarashi. 1988. Site of action of a Vero toxin (VT2) from Escherichia coli O157:H7 and of Shiga toxin on eukaryotic ribosomes: RNA N-glycosidase activity of the toxins. Eur. J. Biochem. 171:45-50. - PubMed
    1. Fernandez, R. C., and A. A. Weiss. 1998. Serum resistance in bvg-regulated mutants of Bordetella pertussis. FEMS Microbiol. Lett. 163:57-63. - PubMed
    1. Gamage, S. D., C. M. McGannon, and A. A. Weiss. 2004. Escherichia coli serogroup O107/O117 lipopolysaccharide binds and neutralizes Shiga toxin 2. J. Bacteriol. 186:5506-5512. - PMC - PubMed

Publication types

MeSH terms

LinkOut - more resources