

Transforming growth factor beta 2 and heme oxygenase 1 genes are risk factors for the cerebral malaria syndrome in Angolan children
- PMID: 20585394
- PMCID: PMC2886838
- DOI: 10.1371/journal.pone.0011141
Transforming growth factor beta 2 and heme oxygenase 1 genes are risk factors for the cerebral malaria syndrome in Angolan children
Abstract
Background: Cerebral malaria (CM) represents a severe outcome of the Plasmodium falciparum infection. Recent genetic studies have correlated human genes with severe malaria susceptibility, but there is little data on genetic variants that increase the risk of developing specific malaria clinical complications. Nevertheless, susceptibility to experimental CM in the mouse has been linked to host genes including Transforming Growth Factor Beta 2 (TGFB2) and Heme oxygenase-1 (HMOX1). Here, we tested whether those genes were governing the risk of progressing to CM in patients with severe malaria syndromes.
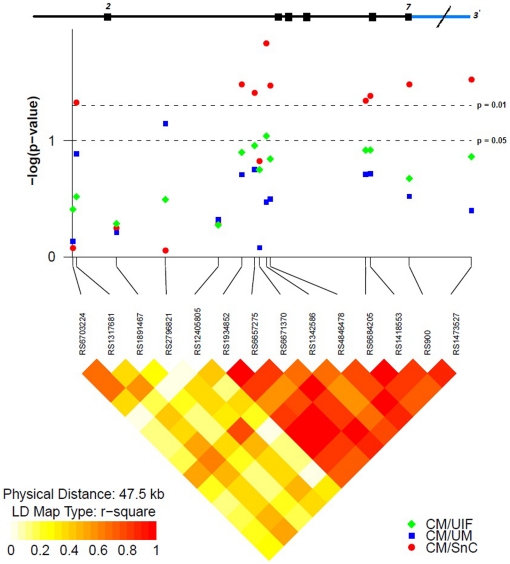
Methodology/principal findings: We report that the clinical outcome of P. falciparum infection in a cohort of Angolan children (n = 430) correlated with nine TGFB2 SNPs that modify the risk of progression to CM as compared to other severe forms of malaria. This genetic effect was explained by two haplotypes harboring the CM-associated SNPs (Pcorrec. = 0.035 and 0.036). In addition, one HMOX1 haplotype composed of five CM-associated SNPs increased the risk of developing the CM syndrome (Pcorrec. = 0.002) and was under-transmitted to children with uncomplicated malaria (P = 0.036). Notably, the HMOX1-associated haplotype conferred increased HMOX1 mRNA expression in peripheral blood cells of CM patients (P = 0.012).
Conclusions/significance: These results represent the first report on CM genetic risk factors in Angolan children and suggest the novel hypothesis that genetic variants of the TGFB2 and HMOX1 genes may contribute to confer a specific risk of developing the CM syndrome in patients with severe P. falciparum malaria. This work may provide motivation for future studies aiming to replicate our findings in larger populations and to confirm a role for these genes in determining the clinical course of malaria.
Conflict of interest statement
Figures

Similar articles
-
Polymorphisms in the RNASE3 gene are associated with susceptibility to cerebral malaria in Ghanaian children.PLoS One. 2011;6(12):e29465. doi: 10.1371/journal.pone.0029465. Epub 2011 Dec 27. PLoS One. 2011. PMID: 22216286 Free PMC article.
-
Polymorphisms in host genes encoding NOSII, C-reactive protein, and adhesion molecules thrombospondin and E-selectin are risk factors for Plasmodium falciparum malaria in India.Eur J Clin Microbiol Infect Dis. 2015 Oct;34(10):2029-39. doi: 10.1007/s10096-015-2448-0. Epub 2015 Jul 21. Eur J Clin Microbiol Infect Dis. 2015. PMID: 26194693
-
Polymorphisms in the Haem Oxygenase-1 promoter are not associated with severity of Plasmodium falciparum malaria in Ghanaian children.Malar J. 2015 Apr 11;14:153. doi: 10.1186/s12936-015-0668-5. Malar J. 2015. PMID: 25888733 Free PMC article.
-
Malaria blood-stage infection and its control by the immune system.Folia Biol (Praha). 2000;46(6):210-8. Folia Biol (Praha). 2000. PMID: 11140853 Review.
-
Genome-wide association studies of severe P. falciparum malaria susceptibility: progress, pitfalls and prospects.BMC Med Genomics. 2019 Aug 14;12(1):120. doi: 10.1186/s12920-019-0564-x. BMC Med Genomics. 2019. PMID: 31409341 Free PMC article. Review.
Cited by
-
Genetics of Malaria Inflammatory Responses: A Pathogenesis Perspective.Front Immunol. 2019 Jul 30;10:1771. doi: 10.3389/fimmu.2019.01771. eCollection 2019. Front Immunol. 2019. PMID: 31417551 Free PMC article. Review.
-
HMOX1 STR polymorphism and malaria: an analysis of a large clinical dataset.Malar J. 2022 Nov 17;21(1):342. doi: 10.1186/s12936-022-04352-x. Malar J. 2022. PMID: 36397106 Free PMC article.
-
Increased carboxyhemoglobin in adult falciparum malaria is associated with disease severity and mortality.J Infect Dis. 2013 Sep 1;208(5):813-7. doi: 10.1093/infdis/jit253. Epub 2013 Jul 12. J Infect Dis. 2013. PMID: 23852587 Free PMC article.
-
The host genetic diversity in malaria infection.J Trop Med. 2012;2012:940616. doi: 10.1155/2012/940616. Epub 2012 Dec 13. J Trop Med. 2012. PMID: 23316245 Free PMC article.
-
Living with the enemy or uninvited guests: functional genomics approaches to investigating host resistance or tolerance traits to a protozoan parasite, Theileria annulata, in cattle.Vet Immunol Immunopathol. 2012 Jul 15;148(1-2):178-89. doi: 10.1016/j.vetimm.2012.03.006. Epub 2012 Mar 12. Vet Immunol Immunopathol. 2012. PMID: 22482839 Free PMC article. Review.
References
-
- Mackintosh CL, Beeson JG, Marsh K. Clinical features and pathogenesis of severe malaria. Trends Parasitol. 2004;20:597–603. - PubMed
-
- Issifou S, Kendjo E, Missinou MA, Matsiegui PB, Dzeing-Ella A, et al. Differences in presentation of severe malaria in urban and rural Gabon. Am J Trop Med Hyg. 2007;77:1015–1019. - PubMed
-
- Newton CR, Krishna S. Severe falciparum malaria in children: current understanding of pathophysiology and supportive treatment. Pharmacol Ther. 1998;79:1–53. - PubMed
-
- Idro R, Jenkins NE, Newton CR. Pathogenesis, clinical features, and neurological outcome of cerebral malaria. Lancet Neurol. 2005;4:827–840. - PubMed
Publication types
MeSH terms
Substances
LinkOut - more resources
Full Text Sources
