. 2010 Jun 18;5(6):e11176.
doi: 10.1371/journal.pone.0011176.

The involvement of IL-17A in the murine response to sub-lethal inhalational infection with Francisella tularensis

Affiliations

The involvement of IL-17A in the murine response to sub-lethal inhalational infection with Francisella tularensis

Gal Markel et al. PLoS One. .

Abstract

Background: Francisella tularensis is an intercellular bacterium often causing fatal disease when inhaled. Previous reports have underlined the role of cell-mediated immunity and IFNgamma in the host response to Francisella tularensis infection.

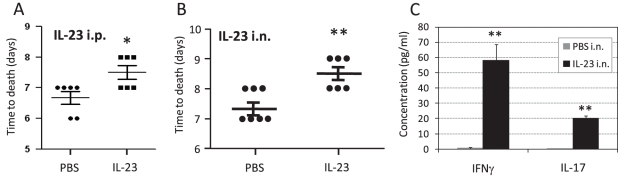
Methodology/principal findings: Here we provide evidence for the involvement of IL-17A in host defense to inhalational tularemia, using a mouse model of intranasal infection with the Live Vaccine Strain (LVS). We demonstrate the kinetics of IL-17A production in lavage fluids of infected lungs and identify the IL-17A-producing lymphocytes as pulmonary gammadelta and Th17 cells. The peak of IL-17A production appears early during sub-lethal infection, it precedes the peak of immune activation and the nadir of the disease, and then subsides subsequently. Exogenous airway administration of IL-17A or of IL-23 had a limited yet consistent effect of delaying the onset of death from a lethal dose of LVS, implying that IL-17A may be involved in restraining the infection. The protective role for IL-17A was directly demonstrated by in vivo neutralization of IL-17A. Administration of anti IL-17A antibodies concomitantly to a sub-lethal airway infection with 0.1xLD(50) resulted in a fatal disease.

Conclusion: In summary, these data characterize the involvement and underline the protective key role of the IL-17A axis in the lungs from inhalational tularemia.


Conflict of interest statement

Competing Interests: The authors have declared that no competing interests exist.

Figures

Figure 1
Figure 1. The effect of lethal intranasal infection with 100×LD50 LVS on activation and recruitment kinetics of lymphocytes in the respiratory system.
(A) Survival of 60 C57BL/6 mice in after intranasal infection with 100×LD50 LVS (Accumulation of six independent experiments with 10 mice in each experiment); (B) Live bacterial counts in lungs (dark bars) and mediastinal lymph nodes (MdLN) (light bars) at the indicated time points after infection. The average count in three animals is shown in each time point. (C) CD69 expression analysis on gated NK cells (NK1.1+CD3 cells) in the lungs (closed diamonds) and MdLN (open squares) at the indicated time points after infection (D) CD69 expression analysis on gated T cells (NK1.1CD3+ cells). The respective insets in both (C) and (D) show the total numbers of NK or T cells; Cells were pooled from three animals at each time point and analyzed; (E) CD69 expression on gated NK and T cells in the lungs or MdLN three days following instillation of PBS (white bars), 100×LD50 live LVS (black bars) or equivalent dose of inactive LVS (gray bars). Cells were analyzed from three pooled animals. Panels B-E depict a representative experiments out of three independent experiments performed. Each time point included three animals.
Figure 2
Figure 2. The effect of sub-lethal intranasal infection with 0.1×LD50 LVS on activation and recruitment kinetics of lymphocytes in the respiratory system.
(A) The mean weight of 60 animals in several independent experiments following intranasal infection with 0.1×LD50 LVS (black circles) or with 100×LD50 LVS (gray squares) is presented (Accumulation of six independent experiments with 10 mice in each experiment). Dashed vertical lines mark the time points selected for bacterial immunological analyses; (B) Live bacterial counts in the lungs (dark bars) and mediastinal lymph nodes (MdLN) (light bars) at the indicated time points after infection. Inset shows the concomitant live bacterial count in the spleen. The average counts out of three animals is shown in each time point; CD69 expression analysis on (C) gated T cells (NK1.1CD3+ cells) and (D) gated NK cells (NK1.1+CD3 cells) in the lungs (closed diamonds) and MdLN (open squares) at the indicated time points after infection. The respective insets show the total numbers of NK or T cells. Cells were analyzed from three pooled animals at each time point. Panels B–D depicts a representative experiment out of three independent experiments performed. Each time point included three animals.
Figure 3
Figure 3. Cytokine expression profile in purified pulmonary T and NK cells following infection with 0.1×LD50.
Figure shows the expression ratio (see below) of cytokines categorized into three groups (indicated on the left) in two main purified pulmonary lymphocyte subpopulations, NK and T cells, at indicated time points following infection with 0.1×LD50. The quantity of cytokine transcripts was determined as described in Materials and Methods.
Figure 4
Figure 4. Accumulation of cytokines in the respiratory tracts following intranasal infection with LVS.
(A) IL-17A and IFNγ concentrations in BALFs of mice infected with various infective doses at the indicated time points. Each of the concentration values represents the mean of 2–3 BALFs collected from individual animals. The letter “D” indicates that the mice infected with the corresponding infective doses could not be measured due to death of the animals. (B) The mean concentration of the indicated cytokines three days post instillation of PBS (naïve), inactive (iLVS) or live (LVS) bacteria. Each of the concentration values represents the mean of 2–3 individual BALFs. Representative experiment out of three performed is shown in panels A and B.
Figure 5
Figure 5. Expression of cytokines by specific pulmonary T cell subpopulations following intranasal infection.
Three T cell subpopulations (indicated on the left) were examined for expression of selected cytokines. Panel (A1–A3) show the number of positive cells, stained intracellularly for the production of the indicated cytokines at the indicated time points following infection with 0.1×LD50 LVS; (B1–B3) compare the number of cells expressing IFNγ or IL-17A at day 2 post infection with 0.1×LD50 (black bars) or with 100×LD50 (gray bars). N/D stands for Not Detected. Cells were analyzed from three pooled animals at each time point. Figure depicts a representative experiment out of three experiments performed.
Figure 6
Figure 6. Kinetics of IL-17A producing pulmonary T cells following intranasal infection.
(A) shows the IL-17A staining in total pulmonary non-lymphocyte cells (left) or lymphocytes (right), at the indicated time points. The total number of pulmonary γδ (B) or CD4+ (C) T cells at indicated time points post intranasal infection with 0.1×LD50 LVS; (D) Total number of IL-17A+ pulmonary γδ or (gray bars) or CD4+ (black bars) T cells at indicated time points post intranasal infection. (E) Percentage of IL-17A-positive T cell subset out of the total IL-17A-positive T cells. Cells were analyzed from three pooled animals at each time point. Figure shows a representative experiment out of three performed.
Figure 7
Figure 7. The effect of γδ T cells knockout on response to intranasal LVS infection.
Wild type (WT) or TCRδ−/− (KO) C57BL/6 mice were intranasally infected with a lethal 10×LD50 (A) or a sub-lethal 0.1×LD50 (B) infective dose. (A) compares the mean time to death (MTTD) and (B) compares the mean percentage of body weight monitoring of the WT and KO groups.
Figure 8
Figure 8. The effect of IL-17A administration on response to intranasal LVS infection.
WT C57BL/6 mice were infected intranasally with a lethal dose of 10×LD50. (A) shows the effects on mice survival of intraperitoneal systemic administration of IL-17A or carrier only at days 0 and 3 post infection with 10×LD50. The time of death of each animal is shown; (B) depicts the effect of intranasal administration of IL-17A in naïve mice on cytokine production. 24 h after instillation of IL-17A (black bars) or PBS carrier (gray bars), BALFs were harvested from three individual animals and the concentrations of the indicated cytokines were determined. Results show the mean concentration values; (C) shows the effects of intranasal administration of IL-17A or carrier only at days 0 and 3 post-infection with 10×LD50. Three doses of IL-17A were tested, as indicated in the figure. The time of death of each animal is shown. Asterisks represent a statistically significant difference (P value <0.05). Results of one experiment out of two performed is presented; (D) shows the pooled results of three independent experiments performed only with the dose of 10 µg IL-17A versus carrier only. Each experimental mice group in each independent experiment included five mice.
Figure 9
Figure 9. The effect of IL-23 administration on response to intranasal LVS infection.
WT C57BL/6 mice were infected intranasally with a lethal dose of 10×LD50. (A) shows the effects on mice survival of systemic intraperitoneal administration of IL-23 or carrier only at the day of infection with 10×LD50. The time of death of each animal is shown; (B) shows the results of intranasal administration of IL-23 or carrier only at the day of infection with 10×LD50. (C) depicts the effects of intranasal administration of IL-23 in naïve mice. 24 h after instillation of IL-23 (black bars) or PBS carrier (gray bars), BALFs were harvested from three individual animals and the concentrations of selected cytokines were determined. Results show the mean concentration values; * represents statistical significance of P value <0.05, ** represents statistical significance of P value <0.01. Figure shows the result of a representative experiment out of three performed. In the other experiments, each mice group included 5-6 mice.
Figure 10
Figure 10. The effect of anti IL-17A antibody administration on response to intranasal LVS infection.
(A) WT C57BL/6 mice were infected with 100 CFU (0.1×LD50). Mice were then injected with 100 µg of neutralizing anti IL-17A mAb (n = 6 animals) or with carrier only (n = 10 animals) on days 0 and 7 post infection. (A1) depicts the cumulative survival of the two experimental groups, P value <0.05; (A2) depicts body weight monitoring of PBS-treated mice (gray diamonds), mAb-treated mice that eventually died (black squares, n = 4 animals) or recovered of the disease (white squares, n = 2 animals). Figure shows one experiment out of two performed (with similar results); (B) WT C57BL/6 mice were infected with 30 CFU. Mice were then injected with 100 µg of neutralizing anti IL-17A mAb (n = 10 animals) or with carrier only (n = 10 animals) on days 0 and 7 post infection. (B1) depicts the cumulative survival of the two experimental groups, P value <0.01; (B2) depicts body weight monitoring of PBS-treated mice (gray diamonds), mAb-treated mice that eventually died (black squares, n = 7 animals) or recovered of the disease (white squares, n = 3 animals). Figure shows one experiment out of two performed (with similar results). *denotes P value <0.05; ** denotes P value <0.01.

Similar articles

Cited by

References

    1. Ellis JP, Oyston C, Green M, Titball RW. Tularemia. Clin Microbiol Rev. 2002;15:631–646. - PMC - PubMed
    1. Sjostedt A. Tularemia: history, epidemiology, pathogen physiology and clinical manifestations. Ann NY Acad Sci. 2007;1005:1–29. - PubMed
    1. Tarvnik A. Nature of protective immunity to Francisella tularensis. Rev Infect Dis. 1989;11:440–451. - PubMed
    1. Dennis DT, Inglesby TV, Henderson DA, Bartlett JG, Ascher MS, et al. Tularemia as a biological weapon: medical and public health management. JAMA. 2001;285:2763–2773. - PubMed
    1. Oyston PC, Sjostedt A, Titball RW. Tularaemia: bioterrorism defense renews interest in Francisella tularensis. Nat Rev Microbiol. 2004;2:967–978. - PubMed

Publication types