

Fast- or slow-inactivated state preference of Na+ channel inhibitors: a simulation and experimental study
- PMID: 20585544
- PMCID: PMC2887460
- DOI: 10.1371/journal.pcbi.1000818
Fast- or slow-inactivated state preference of Na+ channel inhibitors: a simulation and experimental study
Abstract
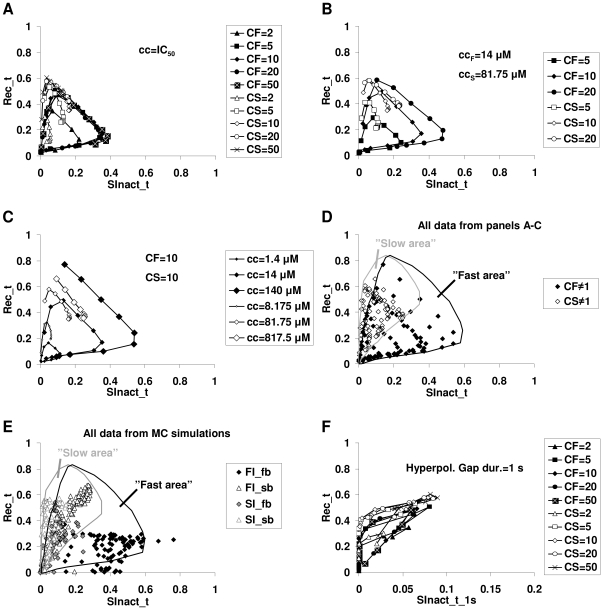
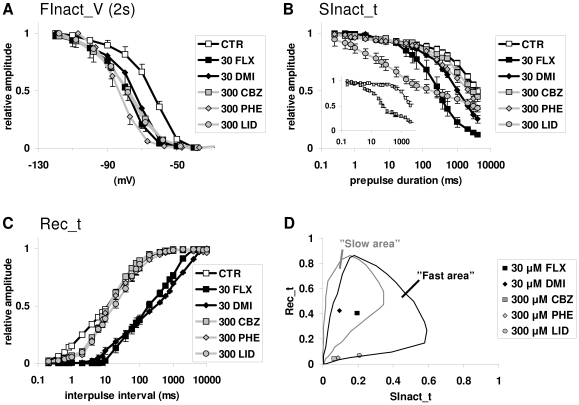
Sodium channels are one of the most intensively studied drug targets. Sodium channel inhibitors (e.g., local anesthetics, anticonvulsants, antiarrhythmics and analgesics) exert their effect by stabilizing an inactivated conformation of the channels. Besides the fast-inactivated conformation, sodium channels have several distinct slow-inactivated conformational states. Stabilization of a slow-inactivated state has been proposed to be advantageous for certain therapeutic applications. Special voltage protocols are used to evoke slow inactivation of sodium channels. It is assumed that efficacy of a drug in these protocols indicates slow-inactivated state preference. We tested this assumption in simulations using four prototypical drug inhibitory mechanisms (fast or slow-inactivated state preference, with either fast or slow binding kinetics) and a kinetic model for sodium channels. Unexpectedly, we found that efficacy in these protocols (e.g., a shift of the "steady-state slow inactivation curve"), was not a reliable indicator of slow-inactivated state preference. Slowly associating fast-inactivated state-preferring drugs were indistinguishable from slow-inactivated state-preferring drugs. On the other hand, fast- and slow-inactivated state-preferring drugs tended to preferentially affect onset and recovery, respectively. The robustness of these observations was verified: i) by performing a Monte Carlo study on the effects of randomly modifying model parameters, ii) by testing the same drugs in a fundamentally different model and iii) by an analysis of the effect of systematically changing drug-specific parameters. In patch clamp electrophysiology experiments we tested five sodium channel inhibitor drugs on native sodium channels of cultured hippocampal neurons. For lidocaine, phenytoin and carbamazepine our data indicate a preference for the fast-inactivated state, while the results for fluoxetine and desipramine are inconclusive. We suggest that conclusions based on voltage protocols that are used to detect slow-inactivated state preference are unreliable and should be re-evaluated.
Conflict of interest statement
The authors have declared that no competing interests exist.
Figures
Similar articles
-
Comparative study of lacosamide and classical sodium channel blocking antiepileptic drugs on sodium channel slow inactivation.J Neurosci Res. 2013 Mar;91(3):436-43. doi: 10.1002/jnr.23136. Epub 2012 Dec 13. J Neurosci Res. 2013. PMID: 23239147
-
V102862 (Co 102862): a potent, broad-spectrum state-dependent blocker of mammalian voltage-gated sodium channels.Br J Pharmacol. 2005 Mar;144(6):801-12. doi: 10.1038/sj.bjp.0706058. Br J Pharmacol. 2005. PMID: 15778702 Free PMC article.
-
Differential block of sensory neuronal voltage-gated sodium channels by lacosamide [(2R)-2-(acetylamino)-N-benzyl-3-methoxypropanamide], lidocaine, and carbamazepine.J Pharmacol Exp Ther. 2008 Jul;326(1):89-99. doi: 10.1124/jpet.107.133413. Epub 2008 Mar 31. J Pharmacol Exp Ther. 2008. PMID: 18378801
-
Molecular properties of brain sodium channels: an important target for anticonvulsant drugs.Adv Neurol. 1999;79:441-56. Adv Neurol. 1999. PMID: 10514834 Review.
-
Mechanism of local anesthetic drug action on voltage-gated sodium channels.Curr Pharm Des. 2005;11(21):2671-86. doi: 10.2174/1381612054546833. Curr Pharm Des. 2005. PMID: 16101448 Review.
Cited by
-
Temperature-dependent changes in neuronal dynamics in a patient with an SCN1A mutation and hyperthermia induced seizures.Sci Rep. 2016 Sep 1;6:31879. doi: 10.1038/srep31879. Sci Rep. 2016. PMID: 27582020 Free PMC article.
-
Response of focal refractory status epilepticus to lacosamide in an infant.BMJ Case Rep. 2022 Apr 29;15(4):e249948. doi: 10.1136/bcr-2022-249948. BMJ Case Rep. 2022. PMID: 35487636 Free PMC article.
-
Effects of Deltamethrin Acute Exposure on Nav1.6 Channels and Medium Spiny Neurons of the Nucleus Accumbens.Toxicology. 2020 Jul;440:152488. doi: 10.1016/j.tox.2020.152488. Epub 2020 May 6. Toxicology. 2020. PMID: 32387285 Free PMC article.
-
Rate-dependent effects of lidocaine on cardiac dynamics: Development and analysis of a low-dimensional drug-channel interaction model.PLoS Comput Biol. 2021 Jun 29;17(6):e1009145. doi: 10.1371/journal.pcbi.1009145. eCollection 2021 Jun. PLoS Comput Biol. 2021. PMID: 34185778 Free PMC article.
-
Effect of phenytoin on sodium conductances in rat hippocampal CA1 pyramidal neurons.J Neurophysiol. 2016 Oct 1;116(4):1924-1936. doi: 10.1152/jn.01060.2015. Epub 2016 Aug 3. J Neurophysiol. 2016. PMID: 27489371 Free PMC article.
References
-
- Patlak J. Molecular kinetics of voltage-dependent Na+ channels. Physiol Rev. 1991;71:1047–1080. - PubMed
-
- Huang CJ, Harootunian A, Maher MP, Quan C, Raj CD, et al. Characterization of voltage-gated sodium-channel blockers by electrical stimulation and fluorescence detection of membrane potential. Nat Biotechnol. 2006;24:439–446. - PubMed
-
- Nau C, Wang GK. Interactions of local anesthetics with voltage-gated Na+ channels. J Membr Biol. 2004;201:1–8. - PubMed
-
- Liu G, Yarov-Yarovoy V, Nobbs M, Clare JJ, Scheuer T, et al. Differential interactions of lamotrigine and related drugs with transmembrane segment IVS6 of voltage-gated sodium channels. Neuropharmacology. 2003;44:413–422. - PubMed
Publication types
MeSH terms
Substances
LinkOut - more resources
Full Text Sources
