

Evidence that adaptation in Drosophila is not limited by mutation at single sites
- PMID: 20585551
- PMCID: PMC2887467
- DOI: 10.1371/journal.pgen.1000924
Evidence that adaptation in Drosophila is not limited by mutation at single sites
Abstract
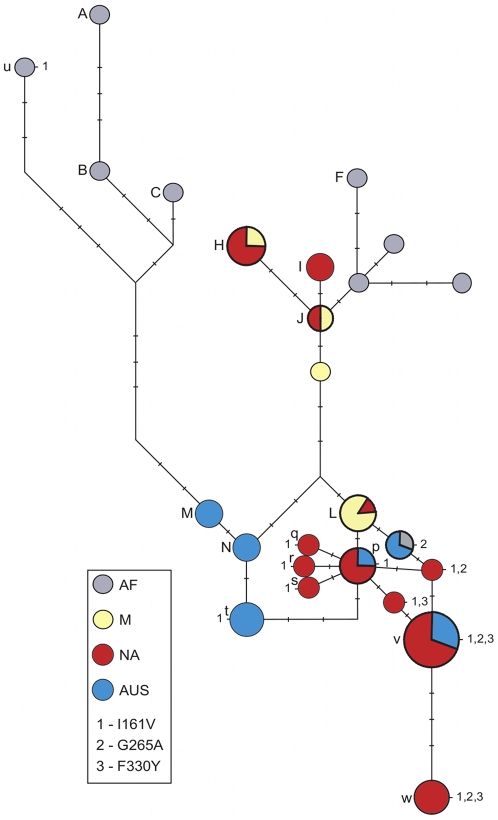
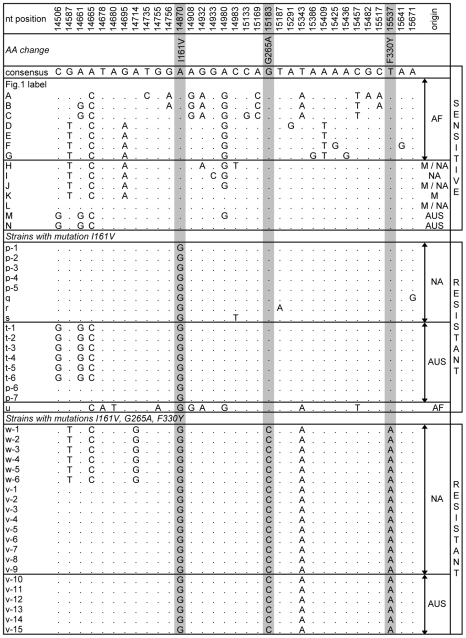
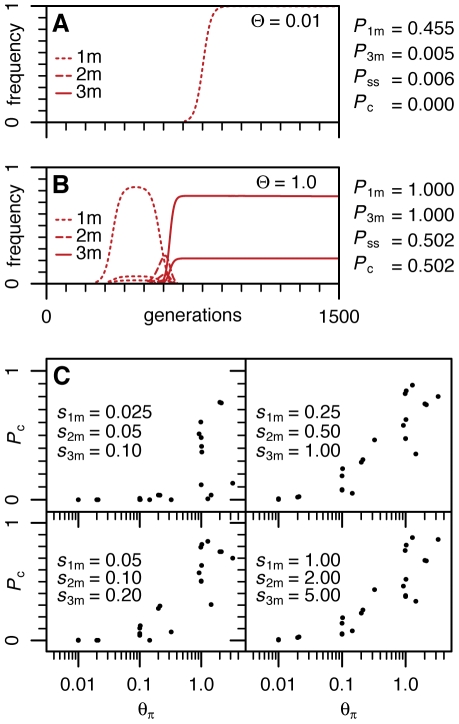
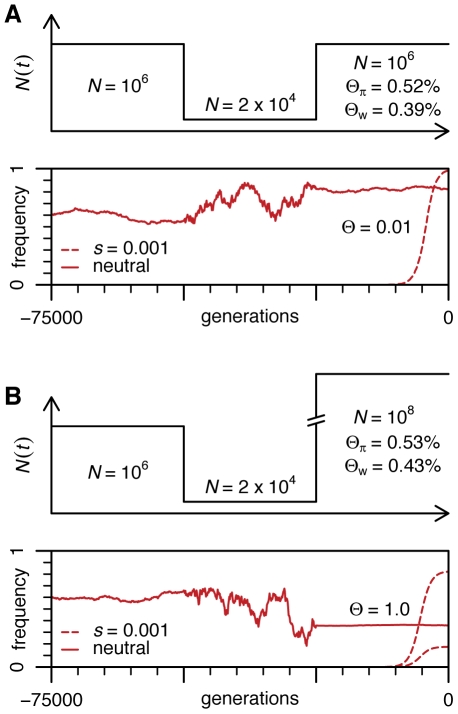
Adaptation in eukaryotes is generally assumed to be mutation-limited because of small effective population sizes. This view is difficult to reconcile, however, with the observation that adaptation to anthropogenic changes, such as the introduction of pesticides, can occur very rapidly. Here we investigate adaptation at a key insecticide resistance locus (Ace) in Drosophila melanogaster and show that multiple simple and complex resistance alleles evolved quickly and repeatedly within individual populations. Our results imply that the current effective population size of modern D. melanogaster populations is likely to be substantially larger (> or = 100-fold) than commonly believed. This discrepancy arises because estimates of the effective population size are generally derived from levels of standing variation and thus reveal long-term population dynamics dominated by sharp--even if infrequent--bottlenecks. The short-term effective population sizes relevant for strong adaptation, on the other hand, might be much closer to census population sizes. Adaptation in Drosophila may therefore not be limited by waiting for mutations at single sites, and complex adaptive alleles can be generated quickly without fixation of intermediate states. Adaptive events should also commonly involve the simultaneous rise in frequency of independently generated adaptive mutations. These so-called soft sweeps have very distinct effects on the linked neutral polymorphisms compared to the standard hard sweeps in mutation-limited scenarios. Methods for the mapping of adaptive mutations or association mapping of evolutionarily relevant mutations may thus need to be reconsidered.
Conflict of interest statement
The authors have declared that no competing interests exist.
Figures
Comment in
-
Understanding adaptation in large populations.PLoS Genet. 2010 Jun 17;6(6):e1000987. doi: 10.1371/journal.pgen.1000987. PLoS Genet. 2010. PMID: 20585547 Free PMC article. No abstract available.
-
Evolution: Rapid change explained by a larger population.Nat Rev Genet. 2010 Aug;11(8):528-9. doi: 10.1038/nrg2838. Epub 2010 Jul 6. Nat Rev Genet. 2010. PMID: 20606626 No abstract available.
Similar articles
-
Recent selective sweeps in North American Drosophila melanogaster show signatures of soft sweeps.PLoS Genet. 2015 Feb 23;11(2):e1005004. doi: 10.1371/journal.pgen.1005004. eCollection 2015 Feb. PLoS Genet. 2015. PMID: 25706129 Free PMC article.
-
Dominance shifts increase the likelihood of soft selective sweeps.Evolution. 2022 May;76(5):966-984. doi: 10.1111/evo.14459. Epub 2022 Apr 7. Evolution. 2022. PMID: 35213740 Free PMC article.
-
Rapid genomic changes in Drosophila melanogaster adapting to desiccation stress in an experimental evolution system.BMC Genomics. 2016 Mar 15;17:233. doi: 10.1186/s12864-016-2556-y. BMC Genomics. 2016. PMID: 26979755 Free PMC article.
-
Population genomics of rapid adaptation by soft selective sweeps.Trends Ecol Evol. 2013 Nov;28(11):659-69. doi: 10.1016/j.tree.2013.08.003. Epub 2013 Sep 25. Trends Ecol Evol. 2013. PMID: 24075201 Free PMC article. Review.
-
How does adaptation sweep through the genome? Insights from long-term selection experiments.Proc Biol Sci. 2012 Dec 22;279(1749):5029-38. doi: 10.1098/rspb.2012.0799. Epub 2012 Jul 25. Proc Biol Sci. 2012. PMID: 22833271 Free PMC article. Review.
Cited by
-
Excessive Parallelism in Protein Evolution of Lake Baikal Amphipod Species Flock.Genome Biol Evol. 2020 Sep 1;12(9):1493-1503. doi: 10.1093/gbe/evaa138. Genome Biol Evol. 2020. PMID: 32653919 Free PMC article.
-
Genomic and Transcriptomic Associations Identify a New Insecticide Resistance Phenotype for the Selective Sweep at the Cyp6g1 Locus of Drosophila melanogaster.G3 (Bethesda). 2016 Aug 9;6(8):2573-81. doi: 10.1534/g3.116.031054. G3 (Bethesda). 2016. PMID: 27317781 Free PMC article.
-
Robust Estimation of Recent Effective Population Size from Number of Independent Origins in Soft Sweeps.Mol Biol Evol. 2019 Sep 1;36(9):2040-2052. doi: 10.1093/molbev/msz081. Mol Biol Evol. 2019. PMID: 30968124 Free PMC article.
-
The Limits to Estimating Population-Genetic Parameters with Temporal Data.Genome Biol Evol. 2020 Apr 1;12(4):443-455. doi: 10.1093/gbe/evaa056. Genome Biol Evol. 2020. PMID: 32181820 Free PMC article.
-
Repeated origins, widespread gene flow, and allelic interactions of target-site herbicide resistance mutations.Elife. 2022 Jan 17;11:e70242. doi: 10.7554/eLife.70242. Elife. 2022. PMID: 35037853 Free PMC article.
References
-
- Charlesworth B. Fundamental concepts in genetics: effective population size and patterns of molecular evolution and variation. Nat Rev Genet. 2009;10:195–205. - PubMed
-
- Zhu KY, Lee SH, Clark JM. A Point Mutation of Acetylcholinesterase Associated with Azinphosmethyl Resistance and Reduced Fitness in Colorado Potato Beetle. Pestic Biochem Physiol. 1996;55:100–108. - PubMed
-
- Anazawa Y, Tomita T, Aiki Y, Kozaki T, Kono Y. Sequence of a cDNA encoding acetylcholinesterase from susceptible and resistant two-spotted spider mite, Tetranychus urticae. Insect Biochem Mol Biol. 2003;33:509–514. - PubMed
-
- Nabeshima T, Mori A, Kozaki T, Iwata Y, Hidoh O, et al. An amino acid substitution attributable to insecticide-insensitivity of acetylcholinesterase in a Japanese encephalitis vector mosquito, Culex tritaeniorhynchus. Biochem Biophys Res Commun. 2004;313:794–801. - PubMed
Publication types
MeSH terms
Grants and funding
LinkOut - more resources
Full Text Sources
Other Literature Sources
Molecular Biology Databases
Miscellaneous
