

On the use of variance per genotype as a tool to identify quantitative trait interaction effects: a report from the Women's Genome Health Study
- PMID: 20585554
- PMCID: PMC2887471
- DOI: 10.1371/journal.pgen.1000981
On the use of variance per genotype as a tool to identify quantitative trait interaction effects: a report from the Women's Genome Health Study
Abstract
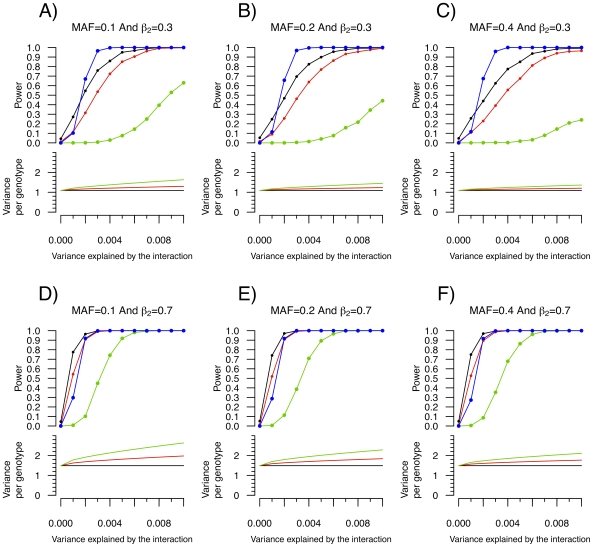
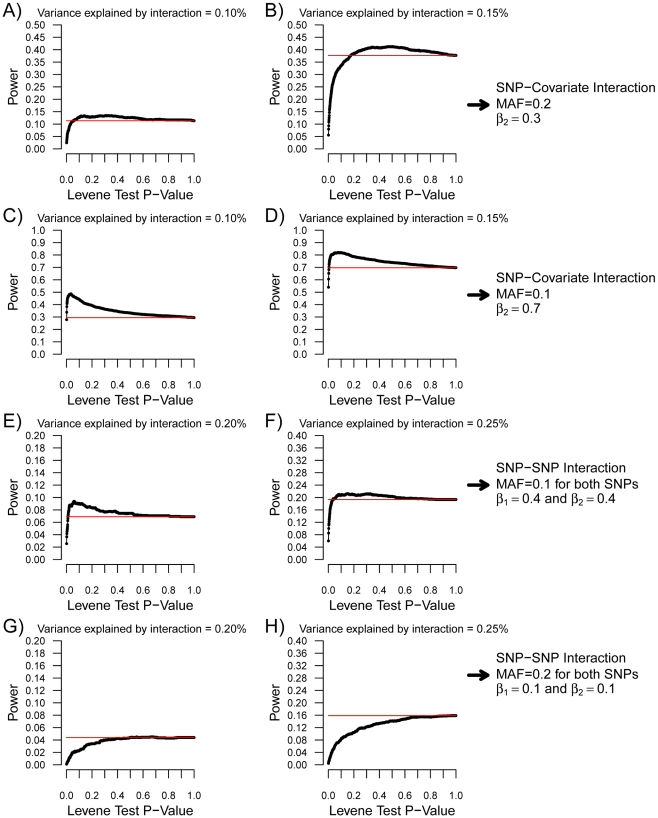
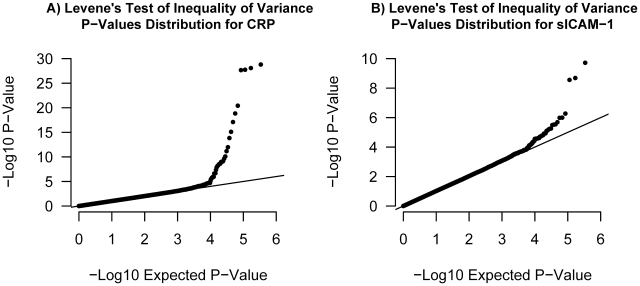
Testing for genetic effects on mean values of a quantitative trait has been a very successful strategy. However, most studies to date have not explored genetic effects on the variance of quantitative traits as a relevant consequence of genetic variation. In this report, we demonstrate that, under plausible scenarios of genetic interaction, the variance of a quantitative trait is expected to differ among the three possible genotypes of a biallelic SNP. Leveraging this observation with Levene's test of equality of variance, we propose a novel method to prioritize SNPs for subsequent gene-gene and gene-environment testing. This method has the advantageous characteristic that the interacting covariate need not be known or measured for a SNP to be prioritized. Using simulations, we show that this method has increased power over exhaustive search under certain conditions. We further investigate the utility of variance per genotype by examining data from the Women's Genome Health Study. Using this dataset, we identify new interactions between the LEPR SNP rs12753193 and body mass index in the prediction of C-reactive protein levels, between the ICAM1 SNP rs1799969 and smoking in the prediction of soluble ICAM-1 levels, and between the PNPLA3 SNP rs738409 and body mass index in the prediction of soluble ICAM-1 levels. These results demonstrate the utility of our approach and provide novel genetic insight into the relationship among obesity, smoking, and inflammation.
Conflict of interest statement
The authors have declared that no competing interests exist.
Figures


Similar articles
-
Variance heterogeneity analysis for detection of potentially interacting genetic loci: method and its limitations.BMC Genet. 2010 Oct 13;11:92. doi: 10.1186/1471-2156-11-92. BMC Genet. 2010. PMID: 20942902 Free PMC article.
-
Genome-wide association analysis of soluble ICAM-1 concentration reveals novel associations at the NFKBIK, PNPLA3, RELA, and SH2B3 loci.PLoS Genet. 2011 Apr;7(4):e1001374. doi: 10.1371/journal.pgen.1001374. Epub 2011 Apr 21. PLoS Genet. 2011. PMID: 21533024 Free PMC article.
-
Analytical strategies to include the X-chromosome in variance heterogeneity analyses: Evidence for trait-specific polygenic variance structure.Genet Epidemiol. 2019 Oct;43(7):815-830. doi: 10.1002/gepi.22247. Epub 2019 Jul 22. Genet Epidemiol. 2019. PMID: 31332826
-
Novel association of ABO histo-blood group antigen with soluble ICAM-1: results of a genome-wide association study of 6,578 women.PLoS Genet. 2008 Jul 4;4(7):e1000118. doi: 10.1371/journal.pgen.1000118. PLoS Genet. 2008. PMID: 18604267 Free PMC article.
-
Application of genome-wide SNP data for uncovering pairwise relationships and quantitative trait loci.Genetica. 2009 Jun;136(2):237-43. doi: 10.1007/s10709-008-9349-4. Epub 2009 Jan 7. Genetica. 2009. PMID: 19127410 Review.
Cited by
-
A transdisciplinary approach to understand the epigenetic basis of race/ethnicity health disparities.Epigenomics. 2021 Nov;13(21):1761-1770. doi: 10.2217/epi-2020-0080. Epub 2021 Mar 10. Epigenomics. 2021. PMID: 33719520 Free PMC article.
-
Model-specific tests on variance heterogeneity for detection of potentially interacting genetic loci.BMC Genet. 2012 Jul 18;13:59. doi: 10.1186/1471-2156-13-59. BMC Genet. 2012. PMID: 22808950 Free PMC article.
-
Genotypic variability based association identifies novel non-additive loci DHCR7 and IRF4 in sero-negative rheumatoid arthritis.Sci Rep. 2017 Jul 13;7(1):5261. doi: 10.1038/s41598-017-05447-1. Sci Rep. 2017. PMID: 28706201 Free PMC article.
-
Screening for interaction effects in gene expression data.PLoS One. 2017 Mar 16;12(3):e0173847. doi: 10.1371/journal.pone.0173847. eCollection 2017. PLoS One. 2017. PMID: 28301596 Free PMC article.
-
Genome-wide association study reveals novel loci for litter size and its variability in a Large White pig population.BMC Genomics. 2015 Dec 9;16:1049. doi: 10.1186/s12864-015-2273-y. BMC Genomics. 2015. PMID: 26652161 Free PMC article.
References
-
- Cordell HJ. Epistasis: what it means, what it doesn't mean, and statistical methods to detect it in humans. Hum Mol Genet. 2002;11:2463–2468. - PubMed
-
- Ritchie MD, Hahn LW, Moore JH. Power of multifactor dimensionality reduction for detecting gene-gene interactions in the presence of genotyping error, missing data, phenocopy, and genetic heterogeneity. Genet Epidemiol. 2003;24:150–157. - PubMed
-
- Bochdanovits Z, Sondervan D, Perillous S, van Beijsterveldt T, Boomsma D, et al. Genome-wide prediction of functional gene-gene interactions inferred from patterns of genetic differentiation in mice and men. PLoS ONE. 2008;3:e1593. doi: 10.1371/journal.pone.0001593. - DOI - PMC - PubMed
Publication types
MeSH terms
Substances
Grants and funding
LinkOut - more resources
Full Text Sources
Research Materials
Miscellaneous
