. 2010 Jun 17;6(6):e1000992.
doi: 10.1371/journal.pgen.1000992.

The IG-DMR and the MEG3-DMR at human chromosome 14q32.2: hierarchical interaction and distinct functional properties as imprinting control centers

Affiliations

The IG-DMR and the MEG3-DMR at human chromosome 14q32.2: hierarchical interaction and distinct functional properties as imprinting control centers

Masayo Kagami et al. PLoS Genet. .

Abstract

Human chromosome 14q32.2 harbors the germline-derived primary DLK1-MEG3 intergenic differentially methylated region (IG-DMR) and the postfertilization-derived secondary MEG3-DMR, together with multiple imprinted genes. Although previous studies in cases with microdeletions and epimutations affecting both DMRs and paternal/maternal uniparental disomy 14-like phenotypes argue for a critical regulatory function of the two DMRs for the 14q32.2 imprinted region, the precise role of the individual DMR remains to be clarified. We studied an infant with upd(14)pat body and placental phenotypes and a heterozygous microdeletion involving the IG-DMR alone (patient 1) and a neonate with upd(14)pat body, but no placental phenotype and a heterozygous microdeletion involving the MEG3-DMR alone (patient 2). The results generated from the analysis of these two patients imply that the IG-DMR and the MEG3-DMR function as imprinting control centers in the placenta and the body, respectively, with a hierarchical interaction for the methylation pattern in the body governed by the IG-DMR. To our knowledge, this is the first study demonstrating an essential long-range imprinting regulatory function for the secondary DMR.


Conflict of interest statement

The authors have declared that no competing interests exist.

Figures
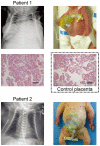
Figure 1
Figure 1. Clinical phenotypes of patients 1 and 2 at birth.
Both patients have bell shaped thorax with coat hanger appearance of the ribs and omphalocele. In patient 1, histological examination of the placenta shows proliferation of dilated and congested chorionic villi, as has previously been observed in a case with upd(14)pat . For comparison, the histological finding of a gestational age matched (33 weeks) control placenta is shown in a dashed square. The horizontal black bars indicate 100 µm.
Figure 2
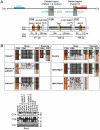
Figure 2. Physical map of the 14q32.2 imprinted region and the deleted segments in patient 1 and her mother and in patient 2 (shaded in gray).
PEGs are shown in blue, MEGs in red, and the IG-DMR (CG4 and CG6) and the MEG3-DMR (CG7) in green. It remains to be clarified whether DIO3 is a PEG, although mouse Dio3 is known to be preferentially but not exclusively expressed from a paternally derived chromosome . For MEG3, the isoform 2 with nine exons (red bars) and eight introns (light red segment) is shown (Ensembl; http://www.ensembl.org/index.html). Electrochromatograms represent the fusion point in patient 1 and her mother, and the fusion point accompanied by insertion of a 66 bp segment (highlighted in blue) with a sequence identical to that within MEG3 intron 5 (the blue bar) in patient 2. Since PCR amplification with primers flanking the 66 bp segment at MEG3 intron 5 has produced a 194 bp single band in patient 2 as well as in a control subject (shown in the box), this indicates that the 66 bp segment at the fusion point is caused by a duplicated insertion rather than by a transfer from intron 5 to the fusion point (if the 66 bp is transferred from the original position, a 128 bp band as well as a 194 bp band should be present in patient 2) (the marker size: 100, 200, and 300 bp). In the FISH images, the red signals (arrows) have been identified by the FISH-1 probe and the FISH-2 probe, and the light green signals (arrowheads) by the RP11-566I2 probe for 14q12 used as an internal control. The faint signal detected by the FISH-2 probe in patient 2 is consistent with the preservation of a ∼1.2 kb region identified by the centromeric portion of the FISH-2 probe.
Figure 3
Figure 3. Methylation analysis of the IG-DMR (CG4 and CG6) and the MEG3-DMR (CG7).
Filled and open circles indicate methylated and unmethylated cytosines at the CpG dinucleotides, respectively. (A) Structure of CG4, CG6, and CG7. Pat: paternally derived chromosome; and Mat: maternally derived chromosome. The PCR products for CG4 (311 bp) harbor 6 CpG dinucleotides and a G/A SNP (rs12437020), and are digested with BstUI into three fragment (33 bp, 18 bp, and 260 bp) when the cytosines at the first and the second CpG dinucleotides and the fourth and the fifth CpG dinucleotides (indicated with orange rectangles) are methylated. The PCR products for CG6 (428 bp) carry 19 CpG dinucleotides and a C/T SNP (rs10133627), and are digested with TaqI into two fragment (189 bp and 239 bp) when the cytosine at the 9th CpG dinucleotide (indicated with an orange rectangle) is methylated. The PCR products for CG7 harbor 7 CpG dinucleotides, and are digested with BstUI into two fragment (56 bp and 112 bp) when the cytosines at the fourth and the fifth CpG dinucleotides (indicated with orange rectangles) are methylated. These enzymes have been utilized for combined bisulfite restriction analysis (COBRA). (B) Methylation analysis. Upper part shows bisulfite sequencing data. The SNP typing data are also denoted for CG4 and CG6. The circles highlighted in orange correspond to those shown in Figure 3A. The relatively long CG6 was not amplified from the formalin-fixed and paraffin-embedded placental samples, probably because of the degradation of genomic DNA. Note that CG4 is differentially methylated in a control placenta and is massively hypermethylated in a upd(14)pat placenta, whereas CG7 is rather hypomethylated in a upd(14)pat placenta as well as in a control placenta. Lower part shows COBRA data. U: unmethylated clone specific bands (311 bp for CG4, 428 bp for CG6, and 168 bp for CG7); and M: methylated clone specific bands (260 bp for CG4, 239 bp and 189 bp for CG6, and 112 bp and 56 bp for CG7). The results reproduce the bisulfite sequencing data, and delineate normal findings of the father of patient 1 and the parents of patient 2.
Figure 4
Figure 4. Methylation analysis of the putative CTCF protein binding sites A–G.
(A) Location and sequence of the putative CTCF binding sites. In the left part, the sites C and D are painted in yellow and the remaining sites in purple. In the right part, the consensus CTCF binding motifs are shown in red letters; the cytosine residues at the CpG dinucleotides within the CTCF binding motifs are highlighted in blue, and those outside the CTCF binding motifs are highlighted in green . (B) Methylation analysis. Upper part shows bisulfite sequencing data, using leukocyte genomic DNA samples. Since PCR products for the site B contain a C/A SNP (rs11627993), genotyping data are also indicated. The circles highlighted in blue correspond to those shown in Figure 4A. The sites C and D exhibit clear DMRs. Lower part indicates the results of the sites C and D using leukocyte and/or placental genomic DNA samples. The findings are similar to those of CG7. (C) Allele-specific methylation pattern of the CTCF binding site D. A novel G/A SNP has been identified in a single control subject, as shown on a reverse chromatogram delineating a C/T SNP pattern, while the previously reported three SNPs were present in a homozygous condition. Methylated and unmethylated clones are associated with the “G” and the “A” alleles, respectively.
Figure 5
Figure 5. Expression analysis.
(A) Reverse transcriptase (RT)-PCR analysis. L: leukocytes; SF: skin fibroblasts; and P: placenta. The relatively weak GAPDH expression for the formalin-fixed and paraffin-embedded placenta of patient 1 indicates considerable mRNA degradation. Since a single exon was amplified for DLK1 and RTL1, PCR was performed with and without RT for the placenta of patient 1, to exclude the possibility of false positive results caused by genomic DNA contamination. (B) Quantitative real-time PCR (q-PCR) analysis of MEG3, MEG8, and miRNAs, using fresh skin fibroblasts (SF) of patient 2 and four control neonates. Of the examined MEGs, miR433 and miR127 are encoded by RTL1as. (C) RT-PCR analysis for the formalin-fixed and paraffin-embedded pituitary (Pit.) and the adrenal (Ad.) in patient 2. The bands for DLK1 are detected in the presence of RT and undetected in the absence of RT, thereby excluding contamination of genomic DNA. (D) Monoallelic MEG3 expression in the leukocytes of the mother of patient 1. The three cSNPs are present in a heterozygous status in gDNA and in a hemizygous status in cDNA. D: direct sequence. (E) Biparental RTL1 expression in the placenta of patient 1 and biparental DLK1 expression in the pituitary and adrenal of patient 2. D: direct sequence; and S: subcloned sequence. In patient 1, genotyping of RTL1 cSNP (rs6575805) using gDNA indicates maternal origin of the “C” allele and paternal origin of the “T” allele, and sequencing analysis using cDNA confirms expression of maternally as well as paternally derived RTL1. Similarly, in patient 2, genotyping of DLK1 cSNP (rs1802710) using gDNA denotes maternal origin of the “C” allele and paternal origin of the “T” alleles, and sequencing analysis using cDNA confirms expression of maternally as well as paternally inherited DLK1.
Figure 6
Figure 6. Schematic representation of the observed and predicted methylation and expression patterns.
Deleted regions in patients 1 and 2 and the mother of patient 1 are indicated by stippled rectangles. P: paternally derived chromosome; and M: maternally derived chromosome. Representative imprinted genes are shown; these genes are known to be imprinted in the body and the placenta (see also Figure S2). Placental samples have not been obtained in patient 2 and the mother of patient 1 (highlighted with light green backgrounds). Thick arrows for RTL1 in patients 1 and 2 represent increased RTL1 expression that is ascribed to loss of functional microRNA-containing RTL1as as a repressor for RTL1 , –; this phenomenon has been indicated in placentas with upd(14)pat and in those with an epimutation and a microdeletion involving the two DMRs (Figure S3A and S3C) . MEG3 and RTL1as that are disrupted or predicted to have become silent on the maternally derived chromosome are written in gray. Filled and open circles represent hypermethylated and hypomethylated DMRs, respectively; since the MEG3-DMR is rather hypomethylated and regarded as non-DMR in the placenta (see also Figure 3), it is painted in gray.

Similar articles

Cited by

References

    1. da Rocha ST, Edwards CA, Ito M, Ogata T, Ferguson-Smith AC. Genomic imprinting at the mammalian Dlk1-Dio3 domain. Trends Genet. 2008;24:306–316. - PubMed
    1. Kagami M, Sekita Y, Nishimura G, Irie M, Kato F, et al. Deletions and epimutations affecting the human 14q32.2 imprinted region in individuals with paternal and maternal upd(14)-like phenotypes. Nat Genet. 2008;40:237–242. - PubMed
    1. Kagami M, Yamazawa K, Matsubara K, Matsuo N, Ogata T. Placentomegaly in paternal uniparental disomy for human chromosome 14. Placenta. 2008;29:760–761. - PubMed
    1. Kotzot D. Maternal uniparental disomy 14 dissection of the phenotype with respect to rare autosomal recessively inherited traits, trisomy mosaicism, and genomic imprinting. Ann Genet. 2004;47:251–260. - PubMed
    1. Temple IK, Shrubb V, Lever M, Bullman H, Mackay DJ. Isolated imprinting mutation of the DLK1/GTL2 locus associated with a clinical presentation of maternal uniparental disomy of chromosome 14. J Med Genet. 2007;44:637–640. - PMC - PubMed

Publication types