. 2010 Jun 24;6(6):e1000966.
doi: 10.1371/journal.ppat.1000966.

Role of PKR and Type I IFNs in viral control during primary and secondary infection

Affiliations

Role of PKR and Type I IFNs in viral control during primary and secondary infection

Yumi Nakayama et al. PLoS Pathog. .

Abstract

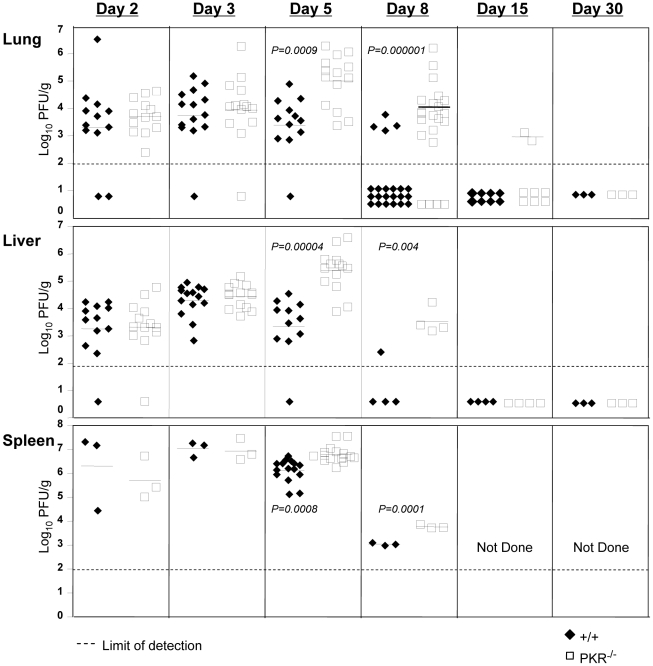
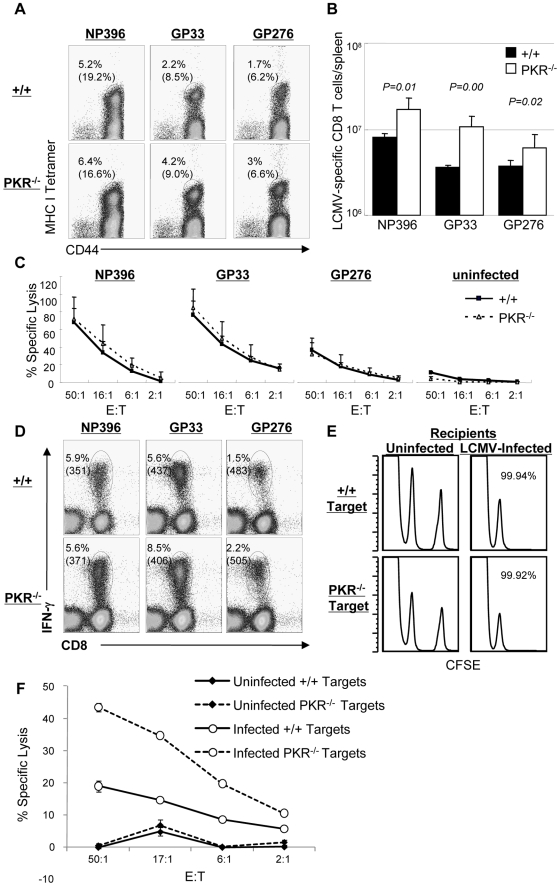
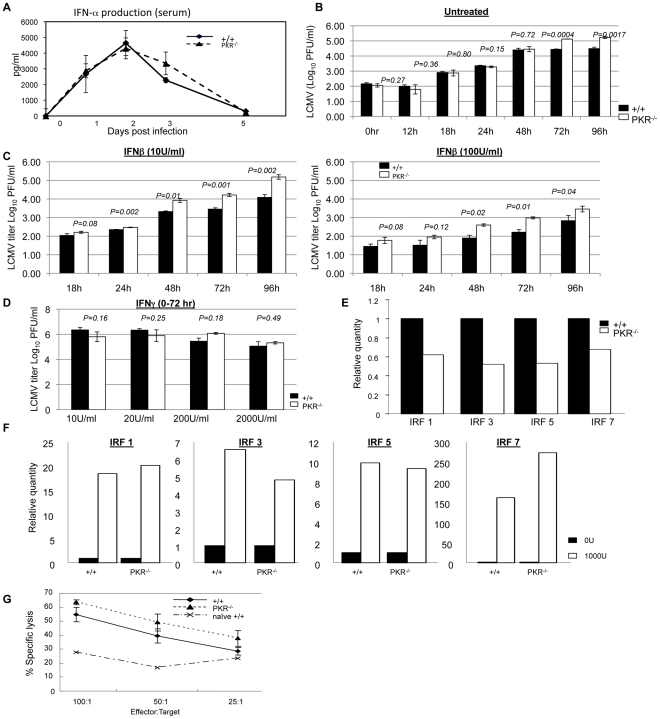
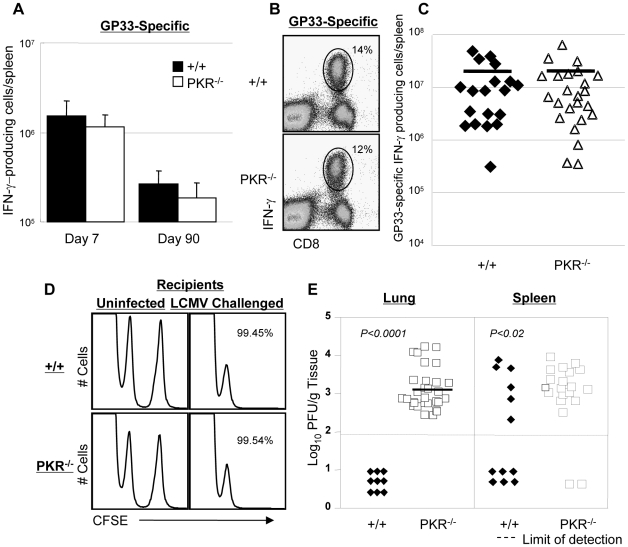
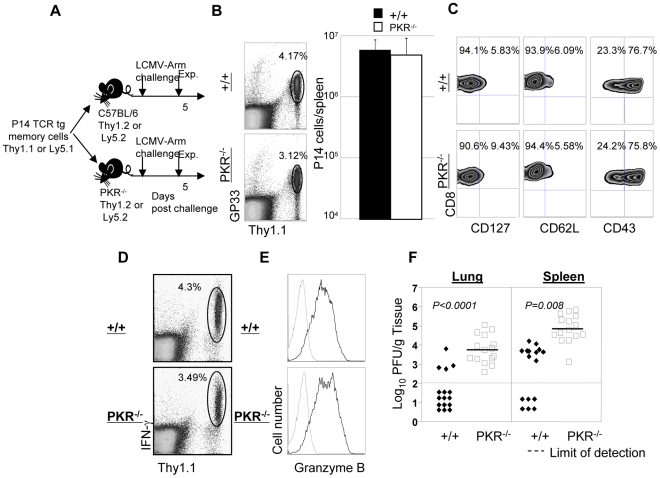
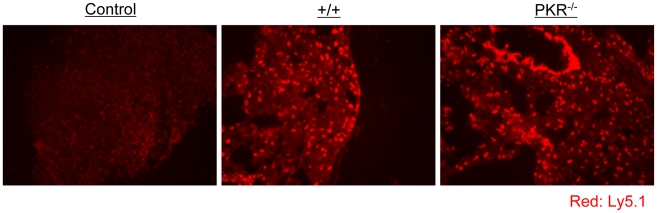
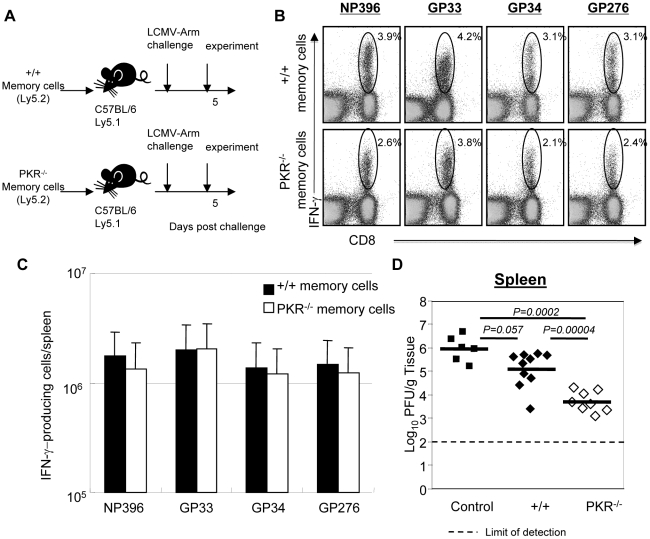
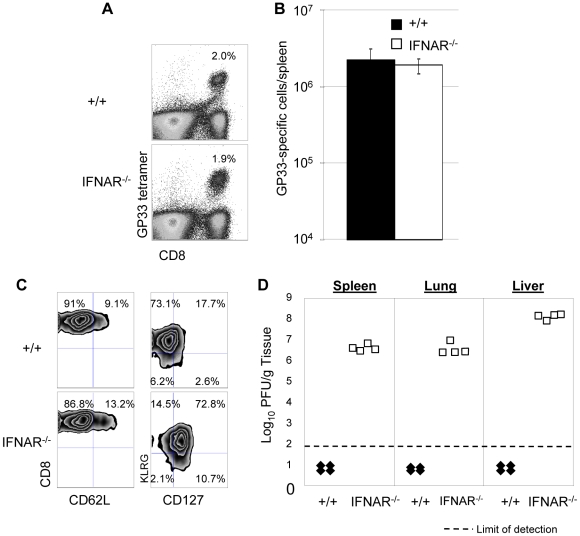
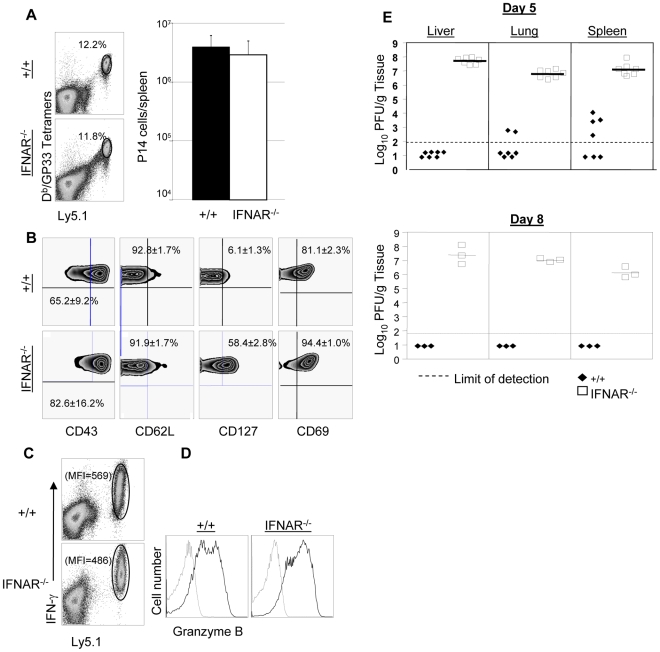
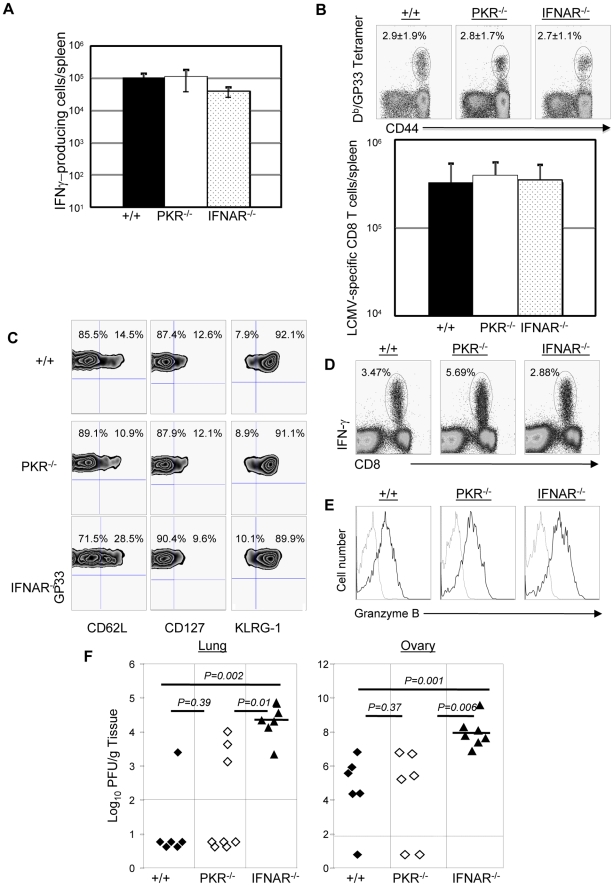
Type I interferons (IFNs) are known to mediate viral control, and also promote survival and expansion of virus-specific CD8+ T cells. However, it is unclear whether signaling cascades involved in eliciting these diverse cellular effects are also distinct. One of the best-characterized anti-viral signaling mechanisms of Type I IFNs is mediated by the IFN-inducible dsRNA activated protein kinase, PKR. Here, we have investigated the role of PKR and Type I IFNs in regulating viral clearance and CD8+ T cell response during primary and secondary viral infections. Our studies demonstrate differential requirement for PKR, in viral control versus elicitation of CD8+ T cell responses during primary infection of mice with lymphocytic choriomeningitis virus (LCMV). PKR-deficient mice mounted potent CD8+ T cell responses, but failed to effectively control LCMV. The compromised LCMV control in the absence of PKR was multifactorial, and linked to less effective CD8+ T cell-mediated viral suppression, enhanced viral replication in cells, and lower steady state expression levels of IFN-responsive genes. Moreover, we show that despite normal expansion of memory CD8+ T cells and differentiation into effectors during a secondary response, effective clearance of LCMV but not vaccinia virus required PKR activity in infected cells. In the absence of Type I IFN signaling, secondary effector CD8+ T cells were ineffective in controlling both LCMV and vaccinia virus replication in vivo. These findings provide insight into cellular pathways of Type I IFN actions, and highlight the under-appreciated importance of innate immune mechanisms of viral control during secondary infections, despite the accelerated responses of memory CD8+ T cells. Additionally, the results presented here have furthered our understanding of the immune correlates of anti-viral protective immunity, which have implications in the rational design of vaccines.


Conflict of interest statement

The authors have declared that no competing interests exist.

Figures

Figure 1
Figure 1. LCMV control in PKR−/− mice.
+/+ and PKR−/− mice were infected with LCMV. Lungs, liver, and spleen from +/+ and PKR−/− mice were collected at days 2, 3, 5, 8, 15, and 30 PI and the viral titers were determined by plaque assay. Each symbol (filled symbol is a +/+ mouse and open symbol is a PKR−/− mouse) represents an individual mouse. The horizontal bar is the average titer of the group, and the dotted line is the limit of detection. Data are from 2-6 independent experiments with 3–4 mice/group.
Figure 2
Figure 2. Primary CD8+ T cell responses in PKR−/− mice.
+/+ and PKR−/− mice were infected intraperitoneally with LCMV, and virus-specific CD8+ T cell responses in spleen was assessed at day 8 PI. A. Splenocytes were stained with MHC class I tetramers, anti-CD8, and anti-CD44 antibodies. The numbers in the dot plots are the percentages of tetramer positive CD8+ T cells amongst splenocytes. The numbers in parenthesis are the percentages of tetramer positive CD8+ T cells of total CD8+ T cells. B. Total numbers of epitope-specific tetramer-binding CD8+ T cells in spleen. C. Cytotoxic activity of CD8+ T cells that are specific to the indicated epitopes was measured by a cytotoxicity assay directly ex vivo. The E:T represents the ratio between splenocytes and peptide pulsed target cells (X axis) D. Antigen-triggered IFN-γ production. IFN-γ production by LCMV-specific CD8+ T cells was assessed by intracellular cytokine staining (ICCS) in vitro. The numbers on top are the percentages of IFN-γ producing cells among total splenocytes. The number in parenthesis is the mean fluorescent intensity (MFI) of IFN-γ. E. The sensitivity of +/+ and PKR−/− target cells to CTL activity was examined by in vivo CTL assay. Splenocytes (target cells) from +/+ and PKR−/− mice were uncoated or coated with GP33 peptide. Uncoated target cells were labeled with a low concentration of CFSE, and GP33-coated target cells were labeled with a high concentration of CFSE. High and low CFSE labeled target cells were mixed 1∶1 and adoptively transferred into naïve (left) or LCMV-infected (day 8 PI) +/+ (right) recipient. Five hours after cell transfer, the presence of donor cells in spleen was analyzed by flow cytometry; the number is the calculated percent specific lysis of adoptively transferred target cells. F. Cell-mediated lysis of LCMV-infected BMDCs from +/+ or PKR−/− mice. Primary BMDCs derived from +/+ or PKR−/− mice were infected with LCMV (1.0 MOI) and used as target cells for lysis by effector CD8+ T cells from spleen of LCMV-infected C57BL/6 mice (day 8 PI). The E:T represents the ratio between splenocytes (effectors) and LCMV-infected target cells (X axis). Data in this figure are representative of two or more independent experiments with 3–4 mice/group.
Figure 3
Figure 3. Innate immune responses to LCMV in PKR−/− mice.
A. +/+ and PKR−/− mice were infected with LCMV and serum samples were collected at days 0, 1, 2, 3, and 5 PI (3–4 mice/group/time point). IFN-α levels in serum were measured using an ELISA kit. B. Triplicate cultures of primary bone marrow-derived dendritic cells (BMDCs) from +/+ and PKR−/− mice were infected with LCMV at 0.01 MOI. The supernatants were collected at the indicated time points and viral titers were determined by plaque assay. C. Triplicate cultures of primary BMDCs from +/+ and PKR−/− mice were pretreated with the indicated levels of IFN-β for 20 to 24 hours, then infected with LCMV at 0.01 MOI. The supernatants were collected at the indicated time points and viral titers were determined by plaque assay. D. Triplicate cultures of BMDCs from +/+ and PKR−/− mice were left untreated or pretreated with indicated doses of IFN-γ for 20 to 24 hours, then infected with LCMV at 0.01 MOI. The supernatants were collected at 72 hours after infection and viral titers were determined by plaque assay. E. Steady state expression levels of IRF-1, IRF-3, IRF-5, and IRF-7 in BMDCs from +/+ or PKR−/− mice. Real-time PCR was used to quantitate mRNA for the indicated IFN-responsive genes. The data are the quantities of mRNAs, relative to expression levels of each gene in cells from +/+ mice. F. Expression of IRF-1, IRF-3, IRF-5, and IRF-7 in +/+ and PKR−/− IFN-β-treated BMDCs. Relative quantities of mRNAs were calculated based on their expression levels in untreated BMDCs from respective +/+ or PKR−/− mice. G. NK cell activity in the spleens of +/+ and PKR−/− mice (n = 3) that were infected with LCMV three days before was measured by NK cell assay. Data in this figure are representative of at least two independent experiments.
Figure 4
Figure 4. Primary and secondary CD8+ T cell responses after Listeria monocytogenes immunization.
A. +/+ and PKR−/− mice were infected with rLM-GP33. At 7 and 90 days after infection, the numbers of GP33-specific IFN-γ-producing CD8+ cells were quantitated by intracellular cytokine staining. B and C. At day 90 PI, LM-GP-immune +/+ and PKR−/− mice were challenged with LCMV. Five days after challenge, the number of GP33-specific IFN-γ-producing CD8+ T cells was assessed by intracellular cytokine staining. Dot plots from representative mice (B) and the absolute numbers of all mice (C) are shown. The horizontal bar in C is the average for each group. D. CTL activity of GP33-specific effector CD8+ T cells in spleen of LCMV-challenged +/+ and PKR−/− mice was measured by in vivo CTL assay at day 5. GP33-coated target cells (CFSEhigh) or uncoated target cells (CFSElow) were transferred into uninfected or LCMV-challenged (Chal-D5) +/+ or PKR−/− mice. The number is the calculated percent specific lysis of adoptively transferred target cells, and representative of data from 3–4 mice/group. E. Viral load in lung and spleen of LCMV-challenged +/+ or PKR−/− mice at day 5. Each symbol represents an individual mouse; filled symbols are +/+ and open symbols are PKR−/− mice. Data in this figure are representative of or derived from 2–8 independent experiments with 3–4 mice/group.
Figure 5
Figure 5. Secondary expansion of TCR tg memory CD8+ T cells in +/+ and PKR−/− mice.
A. Experimental design. Thy1.1+ve P14 memory CD8+ T cells (generated as described in Materials and Methods), were adoptively transferred into congenic Thy1.2/+/+, or Thy1.2/PKR−/− mice. Following cell transfer, mice were challenged with LCMV, and secondary expansion of donor P14 CD8+ T cells was assessed in spleen at day 5 after challenge. B and C. Splenocytes from +/+ or PKR−/− were stained with Db/GP33 MHC I tetramer and anti-Thy1.1; dot plots are gated on total splenocytes, and the numbers are the percentages of P14 CD8+ T cells amongst splenocytes. The total number of P14 cells (right panel in B) is calculated from 5 mice/group. C. Cell surface phenotype of donor P14 CD8+ T cells in LCMV-challenged +/+ and PKR−/− mice; FACS plots are gated on tetramer-binding P14 CD8+ T cells. D. IFN-γ production by donor P14 cells was quantitated by intracellular cytokine staining; dot plots are gated on total splenocytes. E. Splenocytes from LCMV-challenged +/+ or PKR−/− mice were stained for cell surface Thy1.1/CD8 and intracellular granzyme B. FACS histograms are gated on P14 CD8+ T cells; dotted and solid lines represent staining with isotype control and anti-granzyme B antibodies respectively. F. Viral titers in lung and spleen of LCMV-challenged +/+ or PKR−/− mice were determined by plaque assay. Each symbol represents an individual mouse. Results are representative of or derived from 4 independent experiments with 3 to 5 mice per group.
Figure 6
Figure 6. Trafficking of TCR tg P14 CD8+ T cells into infected lungs in +/+ and PKR−/− mice.
As in Figure 5, Ly5.1/P14 TCR tg memory CD8+ T cells were adoptively transferred into +/+ or PKR−/− mice, which were subsequently challenged with LCMV. Five days after challenge, trafficking of Ly5.1/P14 CD8+ T cells into lungs was visualized by immunofluorescent staining with Alexa 568-conjugated anti-Ly5.1 antibodies (Red). Lung section from a +/+ mouse that did not receive Ly5.1/P14 CD8+ T cells is shown as a negative control. Multiple sections from each mouse were analyzed, and results in this figure are representative of data from 3 to 4 mice per group.
Figure 7
Figure 7. Secondary expansion of +/+ or PKR−/− memory CD8+ T cells in Ly5.1/+/+ mice.
A. Experimental design. Ly5.2/+/+ or Ly5.2/PKR−/− mice were infected with LCMV. At 90 days after LCMV infection, CD8+ T cells were purified from spleens of LCMV-immune +/+ or PKR−/− mice. Total CD8+ T cells containing equal number of LCMV-specific memory CD8+ T cells (NP396+GP33+GP276-specific) were adoptively transferred into congenic C57BL/6/Ly5.1+/+ mice. The recipients were challenged with LCMV and the secondary expansion of donor LCMV-specific memory CD8+ T cells was assessed 5 days later. B and C. Antigen-triggered IFN-γ production by donor Ly5.2+ CD8+ T cells was quantitated by intracellular cytokine staining. B. The numbers in the dot plots are the percentage of IFN-γ-producing CD8+ T cells among total splenocytes. C. Absolute number of donor antigen-specific CD8+ T cells in the recipient. D. The viral titer in spleen of LCMV-challenged mice that were recipients of +/+ or PKR−/− memory CD8+ T cells was quantitated by plaque assay; viral titer in mice that did not receive memory CD8+ T cells are shown as controls. Each symbol indicates an individual mouse and the horizontal bar is the average of the group. Results are representative of two independent experiments with 4 to 6 mice per group.
Figure 8
Figure 8. Secondary expansion of GP33-specific CD8+ T cells and viral control in +/+ and IFNAR−/− mice.
+/+ or IFNAR−/− mice were immunized with rLM-GP33. Sixty days after rLM-GP33 infection, mice were challenged with LCMV and GP33-specific CD8+ T cell responses were assessed in spleen five days later. A. The dot plots show expansion of GP33-specific CD8+ T cells in +/+ and IFNAR−/− mice; the numbers are the percentages of GP33-specific CD8+ cells among total splenocytes. B shows total number of GP33-specific CD8+ T cells in spleen of LCMV-challenged +/+ and IFNRA−/− mice. C. Cell surface phenotype of GP33-specific CD8+ T cells. Splenocytes from +/+ or IFNAR−/− mice were stained with antibodies against CD62L, CD127, and KLRG-1 in conjunction with anti-CD8 and Db/GP33 MHC I tetramers. Dot plots are gated on tetramer-binding CD8+ T cells, and the numbers are the percentages of CD62Lhi/low, CD127hi/low, and KLRG-1hi/low cells among tetramer-binding CD8+ T cells. D. Viral titers of spleen, lung, and liver from LCMV-challenged +/+ or IFNAR−/− mice were quantitated by plaque assay; each symbol indicates viral titer of an individual mouse. Results are representative of two independent experiments, with 3 to 4 mice per group.
Figure 9
Figure 9. Expansion of TCR tg P14 memory CD8+ T cells and viral control in IFNAR−/− mice.
As in Figure 5A, Ly5.1/P14 memory CD8+ T cells (generated as described in Materials and Methods), were adoptively transferred into congenic Ly5.2/+/+, or Ly5.2/IFNAR−/− mice; recipient mice were challenged with LCMV and CD8+ T cell responses were assessed five days later. A. Secondary expansion of donor P14 memory CD8+ T cells. Dot plots are gated on total splenocytes, and the numbers are percentages of donor Ly5.1 CD8+ T cells among splenocytes; the accompanying bar graph (right panel) shows total number of P14 CD8+ T cells in spleen of +/+ and IFNRA−/− mice. B. Cell surface phenotype of donor P14 CD8+ T cells. Splenocytes from +/+ or IFNAR−/− recipients were stained with antibodies against CD43, CD62L, CD127, and CD69 in conjunction with anti-Ly5.1, anti-CD8, and Db/GP33 tetramers. FACS plots are gated on tetramer-binding Ly5.1+ve cells, and the numbers are the percentages of CD43hi, CD62Llo, CD127hi, and CD69hi cells among tetramer-binding P14 CD8+ T cells. C. IFN-γ production by P14 cells from +/+ or IFNAR−/− mice were quantitated by intracellular cytokine staining. Note that all Ly5.1+ve P14 CD8+ T cells from +/+ or IFNRA−/− mice produced IFN-γ; the numbers are the MFI for IFN-γ staining. D. Granzyme B expression in P14 cells from +/+ or IFNAR−/− mice. Splenocytes were stained with anti-Ly5.1, anti-CD8, Db/GP33 tetramers, and anti-granzyme B; FACS histograms are gated on Ly5.1+ve tetramer-binding CD8+ T cells; dotted and solid lines show staining with isotype control and anti-granzyme B antibodies respectively. E. Viral titers of liver, lung, and spleen from +/+ or IFNAR−/− mice were quantitated by plaque assay; each symbol represents viral titer in an individual mouse. Results are representative of two independent experiments, with 3 to 4 mice per group.
Figure 10
Figure 10. Secondary expansion of GP33-specific CD8+ T cells and protection against vaccinia virus in +/+, PKR−/−, and IFNAR−/− mice.
+/+, PKR−/−, and IFNAR−/− mice were immunized with rLM-GP33. A. GP33-specific memory CD8+ T cells in LM-GP33-immune +/+, PKR−/− and IFNAR−/− mice. At day 90 PI, the number of GP33-specific memory CD8 T cells in spleen was quantitated by intracellular cytokine staining. B. Secondary expansion of GP33-specific CD8+ T cells in spleen of +/+, PKR−/−, and IFNRA−/− mice. At 90 days after immunization with LM-GP33, +/+, PKR−/− and IFNAR−/− mice were challenged with recombinant vaccinia virus that expresses the glycoprotein of LCMV (VV-GP). Secondary expansion of GP33-specific CD8+ T cells was assessed in spleen five days after VV-GP challenge. Splenocytes were stained with anti-CD8, anti-CD44, and Db/GP33 MHC I tetramers. Dot plots in B are gated on total CD8+ T cells, and the numbers are the percentages of tetramer positive cells among total CD8+ T cells. C. Splenocytes from +/+, PKR−/− or IFNAR−/− recipients were stained with anti-CD8, anti-CD62L, anti-CD127, anti-KLRG-1, and Db/GP33 tetramers. Dot plots are gated on tetramer-binding CD8+ T cells, and the numbers are the percentages of cells in respective quadrants. D. Antigen-triggered IFN-γ production by CD8+ T cells from +/+, PKR−/− or IFNAR−/− mice; dot plots are gated on total splenocytes, and the numbers are the percentage of IFN-γ producing cells amongst splenocytes. E. Granzyme B expression in GP33-specific CD8+ T cells from +/+, PKR−/−, or IFNAR−/− mice were measured by intracellular staining for granzyme B; histograms are gated on Db/GP33- tetramer-binding CD8+ T cells. Dotted and solid lines show staining with isotype control and anti-granzyme B antibodies respectively. F. VV-GP titers in lung and ovary from +/+, PKR−/− or IFNAR−/− mice; each symbol represents data from individual mice. Data is representative of or derived from two independent experiments, 3 to 4 mice per group.

Comment in

Similar articles

Cited by

References

    1. Beutler B. Innate immunity: an overview. Mol Immunol. 2004;40:845–859. - PubMed
    1. Barber GN. Host defense, viruses and apoptosis. Cell Death Differ. 2001;8:113–126. - PubMed
    1. Sadler AJ, Williams BR. Interferon-inducible antiviral effectors. Nat Rev Immunol. 2008;8:559–568. - PMC - PubMed
    1. Biron CA. Interferons alpha and beta as immune regulators–a new look. Immunity. 2001;14:661–664. - PubMed
    1. Havenar-Daughton C, Kolumam GA, Murali-Krishna K. Cutting Edge: The direct action of type I IFN on CD4 T cells is critical for sustaining clonal expansion in response to a viral but not a bacterial infection. J Immunol. 2006;176:3315–3319. - PubMed

Publication types

MeSH terms