

Translational selection is ubiquitous in prokaryotes
- PMID: 20585573
- PMCID: PMC2891978
- DOI: 10.1371/journal.pgen.1001004
Translational selection is ubiquitous in prokaryotes
Abstract
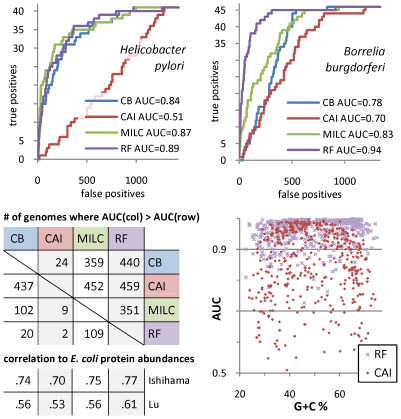
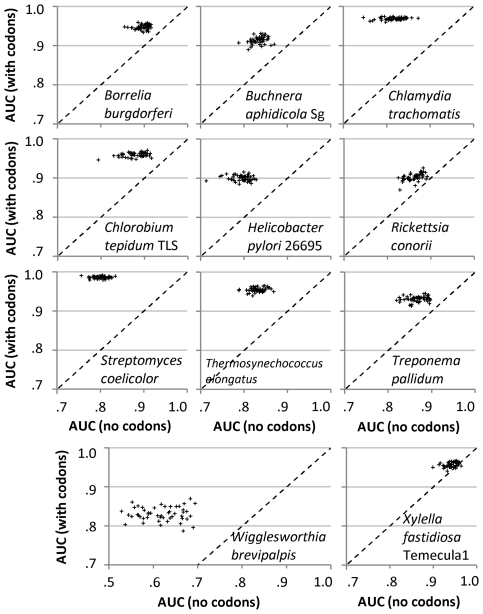
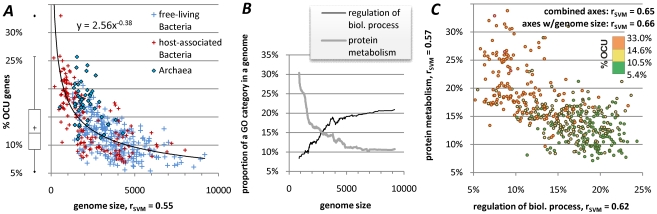
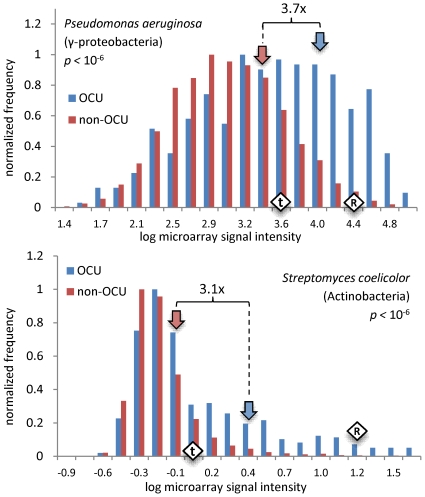
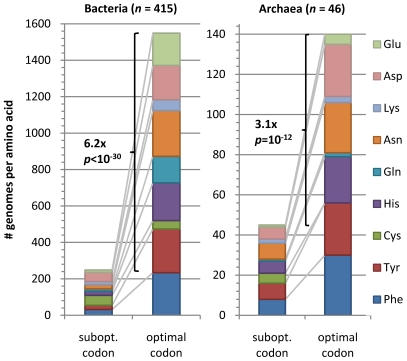
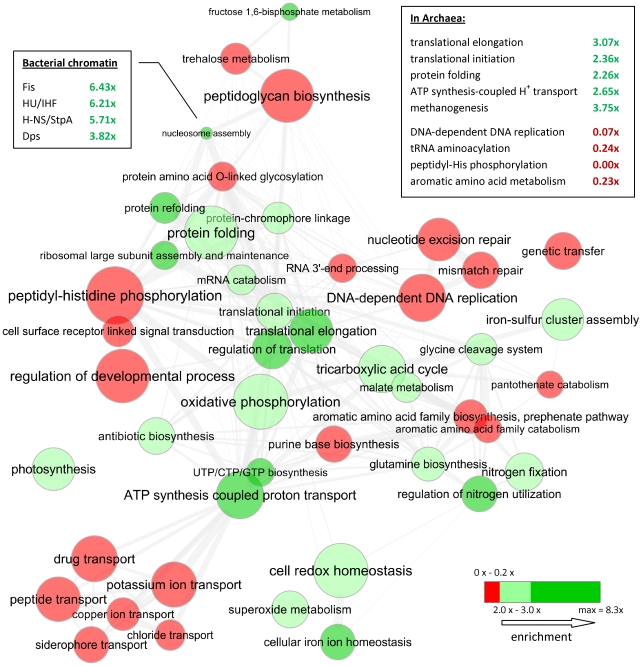
Codon usage bias in prokaryotic genomes is largely a consequence of background substitution patterns in DNA, but highly expressed genes may show a preference towards codons that enable more efficient and/or accurate translation. We introduce a novel approach based on supervised machine learning that detects effects of translational selection on genes, while controlling for local variation in nucleotide substitution patterns represented as sequence composition of intergenic DNA. A cornerstone of our method is a Random Forest classifier that outperformed previous distance measure-based approaches, such as the codon adaptation index, in the task of discerning the (highly expressed) ribosomal protein genes by their codon frequencies. Unlike previous reports, we show evidence that translational selection in prokaryotes is practically universal: in 460 of 461 examined microbial genomes, we find that a subset of genes shows a higher codon usage similarity to the ribosomal proteins than would be expected from the local sequence composition. These genes constitute a substantial part of the genome--between 5% and 33%, depending on genome size--while also exhibiting higher experimentally measured mRNA abundances and tending toward codons that match tRNA anticodons by canonical base pairing. Certain gene functional categories are generally enriched with, or depleted of codon-optimized genes, the trends of enrichment/depletion being conserved between Archaea and Bacteria. Prominent exceptions from these trends might indicate genes with alternative physiological roles; we speculate on specific examples related to detoxication of oxygen radicals and ammonia and to possible misannotations of asparaginyl-tRNA synthetases. Since the presence of codon optimizations on genes is a valid proxy for expression levels in fully sequenced genomes, we provide an example of an "adaptome" by highlighting gene functions with expression levels elevated specifically in thermophilic Bacteria and Archaea.
Conflict of interest statement
The authors have declared that no competing interests exist.
Figures
Similar articles
-
Codon Usage Optimization in the Prokaryotic Tree of Life: How Synonymous Codons Are Differentially Selected in Sequence Domains with Different Expression Levels and Degrees of Conservation.mBio. 2020 Jul 21;11(4):e00766-20. doi: 10.1128/mBio.00766-20. mBio. 2020. PMID: 32694138 Free PMC article.
-
Coupling between protein level selection and codon usage optimization in the evolution of bacteria and archaea.mBio. 2014 Mar 25;5(2):e00956-14. doi: 10.1128/mBio.00956-14. mBio. 2014. PMID: 24667707 Free PMC article.
-
Universal pattern and diverse strengths of successive synonymous codon bias in three domains of life, particularly among prokaryotic genomes.DNA Res. 2012 Dec;19(6):477-85. doi: 10.1093/dnares/dss027. Epub 2012 Nov 6. DNA Res. 2012. PMID: 23132389 Free PMC article.
-
The Code of Silence: Widespread Associations Between Synonymous Codon Biases and Gene Function.J Mol Evol. 2016 Jan;82(1):65-73. doi: 10.1007/s00239-015-9714-8. Epub 2015 Nov 4. J Mol Evol. 2016. PMID: 26538122 Review.
-
Unravelling Prokaryotic Codon Usage: Insights from Phylogeny, Influencing Factors and Pathogenicity.Curr Genomics. 2025;26(2):81-94. doi: 10.2174/0113892029325491240919151045. Epub 2024 Oct 1. Curr Genomics. 2025. PMID: 40433443 Free PMC article. Review.
Cited by
-
Metabolic Specialization and Codon Preference of Lignocellulolytic Genes in the White Rot Basidiomycete Ceriporiopsis subvermispora.Genes (Basel). 2020 Oct 20;11(10):1227. doi: 10.3390/genes11101227. Genes (Basel). 2020. PMID: 33092062 Free PMC article.
-
Characterizing the mutational landscape of MM and its precursor MGUS.Am J Cancer Res. 2022 Apr 15;12(4):1919-1933. eCollection 2022. Am J Cancer Res. 2022. PMID: 35530275 Free PMC article.
-
Genes optimized by evolution for accurate and fast translation encode in Archaea and Bacteria a broad and characteristic spectrum of protein functions.BMC Genomics. 2010 Nov 4;11:617. doi: 10.1186/1471-2164-11-617. BMC Genomics. 2010. PMID: 21050470 Free PMC article.
-
Variation in global codon usage bias among prokaryotic organisms is associated with their lifestyles.Genome Biol. 2011 Oct 27;12(10):R109. doi: 10.1186/gb-2011-12-10-r109. Genome Biol. 2011. PMID: 22032172 Free PMC article.
-
The evolutionary signal in metagenome phyletic profiles predicts many gene functions.Microbiome. 2018 Jul 10;6(1):129. doi: 10.1186/s40168-018-0506-4. Microbiome. 2018. PMID: 29991352 Free PMC article.
References
Publication types
MeSH terms
Substances
LinkOut - more resources
Full Text Sources
