. 2010 Jun 24;5(6):e11305.
doi: 10.1371/journal.pone.0011305.

A femtomol range FRET biosensor reports exceedingly low levels of cell surface furin: implications for the processing of anthrax protective antigen

Affiliations

A femtomol range FRET biosensor reports exceedingly low levels of cell surface furin: implications for the processing of anthrax protective antigen

Katarzyna Gawlik et al. PLoS One. .

Retraction in

Abstract

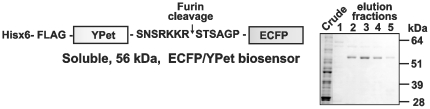
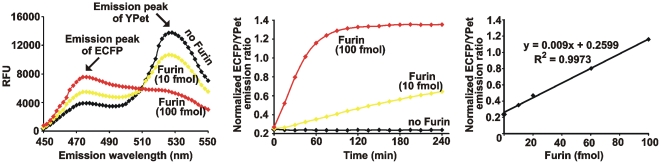
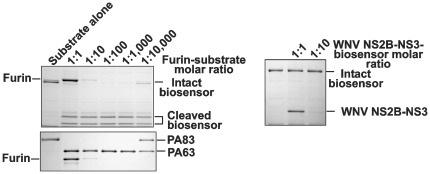
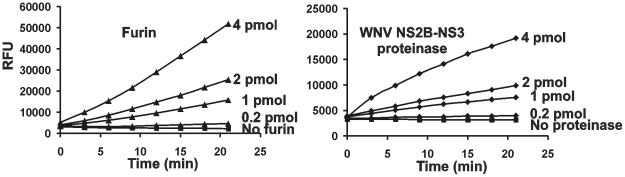
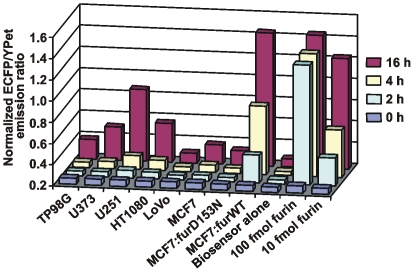
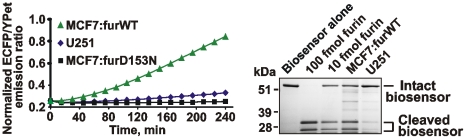
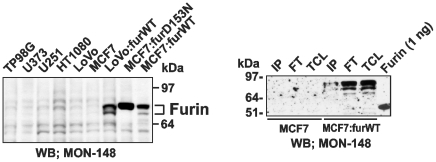
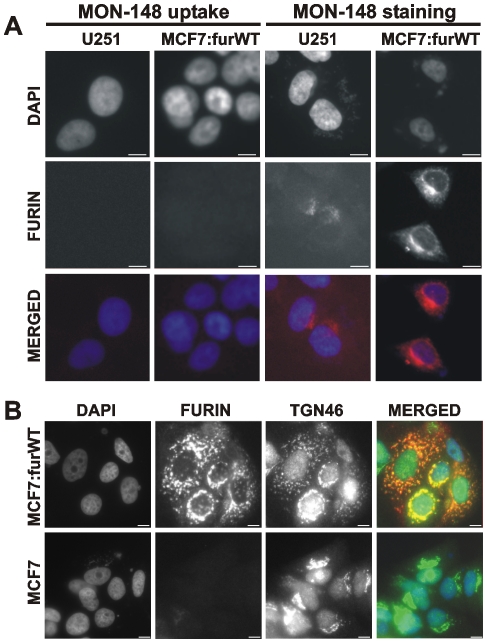
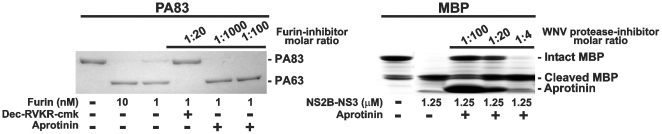
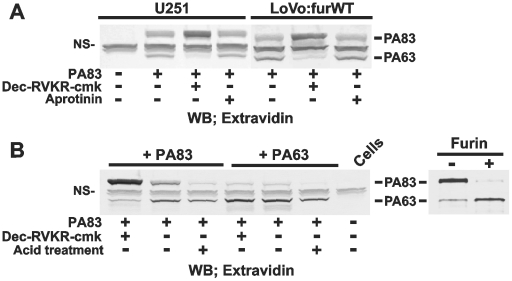
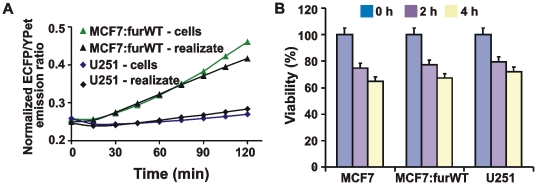
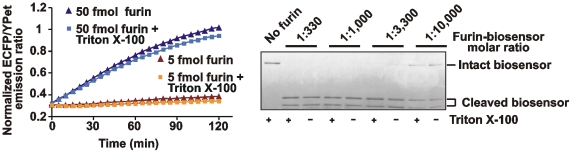
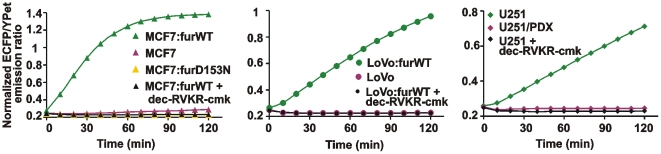
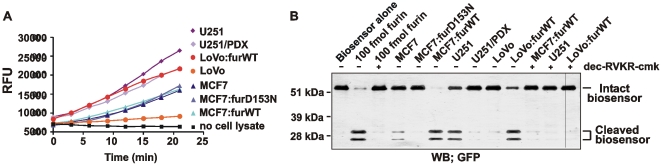
Furin, a specialized endoproteinase, transforms proproteins into biologically active proteins. Furin function is important for normal cells and also in multiple pathologies including malignancy and anthrax. Furin is believed to cycle between the Golgi compartment and the cell surface. Processing of anthrax protective antigen-83 (PA83) by the cells is considered thus far as evidence for the presence of substantial levels of cell-surface furin. To monitor furin, we designed a cleavage-activated FRET biosensor in which the Enhanced Cyan and Yellow Fluorescent Proteins were linked by the peptide sequence SNSRKKR / STSAGP derived from anthrax PA83. Both because of the sensitivity and selectivity of the anthrax sequence to furin proteolysis and the FRET-based detection, the biosensor recorded the femtomolar levels of furin in the in vitro reactions and cell-based assays. Using the biosensor that was cell-impermeable because of its size and also by other relevant methods, we determined that exceedingly low levels, if any, of cell-surface furin are present in the intact cells and in the cells with the enforced furin overexpression. This observation was in a sharp contrast with the existing concepts about the furin presentation on cell surfaces and anthrax disease mechanism. We next demonstrated using cell-based tests that PA83, in fact, was processed by furin in the extracellular milieu and that only then the resulting PA63 bound the anthrax toxin cell-surface receptors. We also determined that the biosensor, but not the conventional peptide substrates, allowed continuous monitoring of furin activity in cancer cell extracts. Our results suggest that there are no physiologically-relevant levels of cell-surface furin and, accordingly, that the mechanisms of anthrax should be re-investigated. In addition, the availability of the biosensor is a foundation for non-invasive monitoring of furin activity in cancer cells. Conceptually, the biosensor we developed may serve as a prototype for other proteinase-activated biosensors.


Conflict of interest statement

Competing Interests: The authors have declared that no competing interests exist.

Figures

Figure 1
Figure 1. The biosensor and its purification.
Left panel, the ECFP/YPet construct was N-terminally tagged with the Hisx6 and FLAG tags. The furin cleavage sequence (SNSRKKR↓STSAGP) of anthrax PA83 was inserted between the N-terminal Met of ECFP and the C-terminal Leu of YPet. Right panel, SDS-gel electrophoresis of the elution fractions of the biosensor purified by Co2+-chelating chromatography.
Figure 2
Figure 2. Characterization of the biosensor.
Left panel, the emission spectra (λex = 437 nm) of the purified biosensor (100 pmol) before and after its cleavage for 1 h at 37°C using purified furin (10 fmol and 100 fmol). RFU, relative fluorescence unit. Middle panel, the time course of the ECFP/YPet emission ratio (476 nm/526 nm at λex = 437 nm) of the biosensor (100 pmol) incubated for 4 h at 37°C with or without furin (10 fmol and 100 fmol). Right panel, a ratiometric response of the normalized ECFP/YPet emission ratio to the increasing concentrations of furin. Incubation time, 1 h. These experiments were repeated multiple times with similar results. The representative experiments are shown.
Figure 3
Figure 3. The biosensor is cleaved by furin but it is resistant to WNV NS2B-NS3 proteinase.
Left panels, the biosensor and PA83 were cleaved by furin (1 h; 37°C) at the indicated enzyme-substrate ratio. Right panel, the biosensor was cleaved by WNV NS2B-NS3 proteinase (1 h; 37°C) at the indicated enzyme-substrate ratio. The cleavage reactions were analyzed by SDS-gel electrophoresis followed by Coomassie staining.
Figure 4
Figure 4. The similar activity of furin and WNV NS2B-NS3 proteinase against Pyr-RTKR-AMC.
Both furin and WNV NS2B-NS3 proteinase (0.2-4 pmol each) were allowed to cleave the fluorescent peptide for the indicated time. RFU, relative fluorescence unit.
Figure 5
Figure 5. Activation of the biosensor by cellular furin.
Adherent glioma TP98G, U373 and U251 cells, fibrosarcoma HT1080 cells, colon carcinoma LoVo cells and breast carcinoma MCF-7, MCF-7:furD153N and MCF-7:furWT cells (5×10⁴) were co-incubated for 2–16 h with the biosensor (100 pmol).
Figure 6
Figure 6. Activation and cleavage of the biosensor by cellular furin.
Left panel, the time course of the biosensor cleavage by U251, MCF-7:furWT and MCF-7:fur:D153N cells (5×10⁴). Right panel, SDS-gel electrophoresis of the cleavage reactions. Cells (5×10⁴) were incubated for 4 h with the biosensor (100 pmol). After centrifugation, the supernatant samples were separated by SDS-gel electrophoresis followed by Coomassie staining. Purified furin (10 fmol and 100 fmol) was used as a control.
Figure 7
Figure 7. Analysis of cellular furin.
Left panel, Western blotting of total cell furin (15 µg total protein that corresponded to 5-7×10⁴ cells depending on a cell type). Right panel, Western blotting of cell surface-associated furin. MCF-7 and MCF-7:furWT cells (15×106) were cell surface biotinylated using membrane-impermeable biotin. Biotin-labeled furin was immunoprecipitated from the total cell lysate (TCL) using streptavidin-agarose beads. The beads were washed in 50 mM Tris-HCl, pH 7.4, supplemented with 50 mm N-octyl-β-d-glucopyranoside, 150 mM NaCl, 1 mm CaCl2, 1 mm MgCl2, a proteinase inhibitor cocktail set III, and 1 mm PMSF (FT, flow through fraction). The immunocaptured proteins (IP, immunoprecipitated protein fraction) were eluted using 1% SDS. The fractions were analyzed by Western blotting with the furin MON-148 antibody followed by donkey anti-mouse IgG-conjugated with horseradish peroxidase and a SuperSignal West Dura Extended Duration Substrate kit. The gels were overexposed to demonstrate the presence of cell-surface furin. Right lane, purified furin (1 ng). WB, Western blotting.
Figure 8
Figure 8. Furin is expressed in the trans-Golgi network in MCF-7:furWT cells.
A, left panels, the uptake of the MON-148 furin antibody did not reveal cell surface furin in U251 and MCF-7:furWT cells. Cells were allowed to bind the antibody at 4°C. Cells were then incubated at 37°C to stimulate the antibody uptake, fixed, permeabilized and stained with the Alexa Fluor 594-conjugated secondary antibody (red). Right panels, staining of cellular furin. Cells were fixed, permeabilized and stained using the MON-148 antibody followed by the Alexa Fluor 594-conjugated secondary antibody. B, MCF-7:furWT and MCF-7 cells were fixed, permeabilized and stained using the rabbit polyclonal TGN46 antibody (green) and the MON-148 furin antibody (red). The merged panels show the level of co-localization of furin with TGN46 (a trans-Golgi network marker). Original magnification ×400; the bar, 10 µm. The nuclei were stained with DAPI (blue).
Figure 9
Figure 9. Aprotinin inhibits WNV NS2B-NS3 proteinase activity but not furin.
PA83 (1 µM) and myelin basic protein (MBP; 11 µM) were incubated for 1 h at 37°C with furin (1–10 nM; 1∶100-1∶1,000 enzyme-substrate molar ratio) and WNV NS2B-NS3 proteinase (1.25 µM; 1∶10 enzyme-substrate molar ratio) in the presence of the indicated enzyme-inhibitor molar ratio.
Figure 10
Figure 10. Specific processing of PA83 by cellular furin.
A, LoVo:furWT and U251 cells were co-incubated for 3 h at 37°C with bPA83 (1 µg/ml). Where indicated, cells were pre-incubated for 20 min with dec-RVKR-cmk (25 µM) or aprotinin (100 µM) prior to the addition of bPA83. Cell lysates were examined using Western blotting with horseradish peroxidase-conjugated ExtrAvidin and a TMB/M substrate. B, left panel, U251 cells were incubated for 3 h at 37°C with bPA83 (1 µg/ml) with or without dec-RVKR-cmk (25 µM). Where indicated, cells were exposed to the acid pH treatment to remove the cell surface-associated bPA83 and bPA63. Right panel, conversion of bPA83 into bPA63 using purified furin. The gels were stained with Coomassie. WB, Western blotting. NS, non-specific band.
Figure 11
Figure 11. Furin activity was released by the cells.
A, the time course of the biosensor cleavage by cell realizate and by adherent MCF-7:furWT and U251 cells. Cells (5×10⁴) were incubated for 2 h in 100 mM Hepes, pH 7.5, containing 150 mM NaCl, 1 mM CaCl2, 1 mM MgCl2 and 1% ITS. The cells were then separated by centrifugation and the supernatant (realizate) was co-incubated with the biosensor for 0–120 min. Alternatively, adherent cells (5×10⁴) were directly co-incubated with the biosensor. B, ATP-Lite cell viability assay. Prior to the assay, MCF-7, MCF-7:furWT and U251 cells were incubated for 2–4 h at 37°C in 100 mM Hepes, pH 7.5, containing 150 mM NaCl, 1 mM CaCl2, 1 mM MgCl2 and 1% ITS. The level of induced apoptosis was then determined using an ATP-Lite kit.
Figure 12
Figure 12. The biosensor cleavage in cell lysates.
Left panel, Triton X-100 (0.1%) does not affect the efficiency of furin proteolysis of the biosensor. The biosensor was co-incubated with purified furin (5 fmol and 50 fmol) for 0-120 min with or without 0.1% Triton X-100. Right panel, the biosensor was co-incubated 1 h with purified furin at the indicated enzyme-substrate molar ratio. The digests were analyzed by SDS-gel electrophoresis followed by Coomassie staining. Where indicated, reactions contained 0.1% Triton X-100.
Figure 13
Figure 13. The biosensor allows to measure reliably furin activity in cell lysates.
The time course of the biosensor cleavage by the MCF-7, LoVo and U251 total cell lysates. The cells were lysed for 1 h at 4°C in the buffer containing 0.1% Triton X-100. The insoluble material was discarded by centrifugation. The supernatant aliquots (50 µg total protein; an equivalent of ∼5×10⁴ cells) were co-incubated for 2 h at 37°C with the biosensor (100 pmol).
Figure 14
Figure 14. The fluorescent peptide substrate does not allow to measure reliably furin activity in cell lysates.
A, the cleavage of Pyr-RTKR-AMC by the supernatant aliquots (50 µg total protein for MCF-7 and LoVo cells and 5 µg total protein for U251 cells). RFU, relative fluorescence unit. B, the biosensor (100 pmol) was co-incubated for 2 h with the total cell lysates or with the purified furin (100 fmol). The digests were analyzed by Western blotting with the GFP antibody. Where indicated, dec-RVKR-cmk was added to the reactions. WB, Western blotting.

Similar articles

Cited by

References

    1. Kiyokawa E, Hara S, Nakamura T, Matsuda M. Fluorescence (Forster) resonance energy transfer imaging of oncogene activity in living cells. Cancer Sci. 2006;97:8–15. - PMC - PubMed
    1. Ai HW, Hazelwood KL, Davidson MW, Campbell RE. Fluorescent protein FRET pairs for ratiometric imaging of dual biosensors. Nat Methods. 2008;5:401–403. - PubMed
    1. Shaner NC, Steinbach PA, Tsien RY. A guide to choosing fluorescent proteins. Nat Methods. 2005;2:905–909. - PubMed
    1. Wang Y, Shyy JY, Chien S. Fluorescence proteins, live-cell imaging, and mechanobiology: seeing is believing. Annu Rev Biomed Eng. 2008;10:1–38. - PubMed
    1. Ouyang M, Huang H, Shaner N, Remacle AG, Shiryaev SA, et al. Simultaneous Visualization of Pro-tumorigenic Src and MT1-MMP Activities with Fluorescence Resonance Energy Transfer. Cancer Res. 2010;70:2204–2212. - PMC - PubMed

Publication types