. 2010 Jun 24;6(6):e1000825.
doi: 10.1371/journal.pcbi.1000825.

Slope-based stochastic resonance: how noise enables phasic neurons to encode slow signals

Affiliations

Slope-based stochastic resonance: how noise enables phasic neurons to encode slow signals

Yan Gai et al. PLoS Comput Biol. .

Abstract

Fundamental properties of phasic firing neurons are usually characterized in a noise-free condition. In the absence of noise, phasic neurons exhibit Class 3 excitability, which is a lack of repetitive firing to steady current injections. For time-varying inputs, phasic neurons are band-pass filters or slope detectors, because they do not respond to inputs containing exclusively low frequencies or shallow slopes. However, we show that in noisy conditions, response properties of phasic neuron models are distinctly altered. Noise enables a phasic model to encode low-frequency inputs that are outside of the response range of the associated deterministic model. Interestingly, this seemingly stochastic-resonance (SR) like effect differs significantly from the classical SR behavior of spiking systems in both the signal-to-noise ratio and the temporal response pattern. Instead of being most sensitive to the peak of a subthreshold signal, as is typical in a classical SR system, phasic models are most sensitive to the signal's rising and falling phases where the slopes are steep. This finding is consistent with the fact that there is not an absolute input threshold in terms of amplitude; rather, a response threshold is more properly defined as a stimulus slope/frequency. We call the encoding of low-frequency signals with noise by phasic models a slope-based SR, because noise can lower or diminish the slope threshold for ramp stimuli. We demonstrate here similar behaviors in three mechanistic models with Class 3 excitability in the presence of slow-varying noise and we suggest that the slope-based SR is a fundamental behavior associated with general phasic properties rather than with a particular biological mechanism.


Conflict of interest statement

The authors have declared that no competing interests exist.

Figures
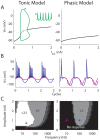
Figure 1
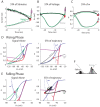
Figure 1. Basic property of the tonic and the phasic models in response to simple current injections.
(A) Bifurcation diagrams of the tonic (left) and phasic (right) models obtained with steady-state current (I DC). Solid lines represent stable equilibrium. The tonic model displays repetitive firing over a range of I DC (green). The inset marked with * is a 20-ms voltage trace obtained when I DC = 0.6 nA. (B) and (C) Responses of the tonic (left) and phasic (right) models to sinusoidal inputs with zero mean replotted from . (B), two voltage traces over three stimulus cycles for input amplitude and frequency marked in the lower panels (*). (C) frequency-response maps of the models. Gray-scale colors represent spiking ratios (number of spikes over number of cycles) to a sinusoid current input with varying frequency (x axis) and amplitude (y axis).
Figure 2
Figure 2. Voltage traces of the phasic model (right) in response to ramp stimulus with different slopes (left).
Figure 3
Figure 3. Average firing rate (A), SNR (B), and SPA (C) vs. standard deviations of noise (bottom horizontal axis) and of V m (top axis) for the tonic (left) and phasic (right) models.
The red dotted line is a fit to the SNR for the smaller signal amplitude using Equation 4. The voltage σ was obtained separately when the spiking mechanism was disabled by setting the activation/inactivation variables of the I Na and I KHT to their resting values. The points and letters marked in the lower panels indicate the noise σ values (tonic model, σ = 2, 5, and 14 pA for a, b, and d; phasic model, σ = 5, 10, 17 and 25 pA for a, b, c, and d) that are used in Fig. 4. The legends show signal amplitude. Signal frequency was 20 Hz.
Figure 4
Figure 4. Comparisons of the tonic and phasic models for power-spectrum density (PSD), period histogram, and inter-spike interval (ISI) histogram at different representative noise levels (specified in Fig. 3 ).
The amplitude of the signal was 0.2 and 2 nA for the tonic and phasic models, respectively. Signal frequency was 20 Hz. The dotted lines in the period histogram plots represent the time course of the sinusoidal signal for illustration purpose. Two identical cycles of period histograms are plotted. The scale of the vertical axes of the PSD and period histogram plots are fixed over all the panels. The scale of the vertical axes of the ISI histogram plots are not fixed due to a large variation of values across panels. The average firing rate (sp/s) is marked in the upper right corner of each panel.
Figure 5
Figure 5. SNR computed at the first harmonic of the signal frequency (thick solid lines in the bottom panels) for condition c in Fig. 4 .
The small top panel shows the PSD at the noise level marked with the star in the SNR plot on the right. For comparison, SNR computed at the fundamental of the signal frequency (thin dotted lines) are re-plotted from Fig. 3. F, fundamental (20 Hz). H, harmonic (40 Hz).
Figure 6
Figure 6. Spike-triggered averages (STAs) for spikes occurring in a 4-ms window centering at the rising (gray) and falling (black) phases of the 20-Hz signal (As = 2 nA) for the phasic model.
The signal alone and its responses are plotted in green. (A) STA of stimulus. (B) STA of V m. (C) STA of w, which is the fast gating variable of the I KLT. (D) and (E) Voltage-w phase-plane analysis. Two phase points, one before and one after the initiation of the averaged action potential (AP) for the rising or falling phase are marked with circles and squares, respectively. The corresponding phase points in the signal's trajectory are marked with triangles (I = −150 and −25 pA for the rising phase; I = 150 and 25 pA for the falling phase). Blue dotted, V m nullcline. Blue solid, w nullcline. Red and purple, threshold separatrix. (F) Period histogram showing the selection of spikes. Note that only spikes with a previous inter-spike interval longer than half of the signal cycle were included to avoid averaging action potentials with subthreshold V m. The stimulus condition is as marked with c in Fig. 3. Stimulus duration was 500 s. Noise σ was 15 pA.
Figure 7
Figure 7. Firing rate as a function of input mean or input slope.
(A) and (B) Firing rates vs. input mean (I, lower horizontal axis) in the presence of noise. Colored lines, instantaneous firing rate converted from period histograms when the input was white noise plus a 20 or 30 Hz sinusoid (A = 0.2 and 2 nA for the tonic and phasic models, respectively), which provided a noisy input with time-varying I. Spikes were separated for the signal's rising (solid) and falling (dotted) phases. Each phase covered a half cycle of the sinusoid. The curves were smoothed with Gaussian functions with a standard deviation of 0.5 ms. Black solid lines, average firing rate when I was fixed for 10 s. The top horizontal axis indicates the average V m for fixed I values when the spiking mechanism was disabled by setting the activation/inactivation variables of the I Na and I KHT to their resting values. (C) and (D) Firing rates vs. I and slope (dI/dt) in the presence of noise. The firing rate is represented by the color. Noise σ was 10 and 15 pA for the tonic (left) and phasic (right) models, respectively.
Figure 8
Figure 8. Average firing rate vs. signal amplitude for different noise intensity (σ).
The signal is a 20-Hz sinusoid. The two orange arrows indicate the signal amplitudes used in the previous simulations for the noise-gated signal encoding. Duration of the stimulus was 10 s.
Figure 9
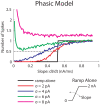
Figure 9. Number of spikes vs. slope of the ramp stimulus for the phasic model when white noise of different intensity (σ) was added to the ramp.
Intersections between the solid lines and the black dotted line define the slope threshold. The small plot on the lower right shows the ramp stimulus without noise. Number of spikes was measured during the sloping part of the stimulus and was averaged over 200 repetitions. Note that the duration of the sloping part for spike counting varies with the slope. The large number of spikes when strong noise was added to a ramp with shallow slopes was caused by responses to the noise within a long spike-counting window.
Figure 10
Figure 10. Responses of other models and neuron to a subthreshold signal with noise.
(A–C) Period histograms in response to subthreshold signals with different amount of noise added. (A) The phasic Hodgkin and Huxley (HH) model (Clay et al. 2008) at 18.5°C. The signal was a sinusoid with A s = 15 nA/cm2. (B) A new phasic model created from the tonic model (I KLT was frozen) by shifting the voltage dependency of the sodium inactivation by −15 mV at 32°C. The signal was a sinusoid with A s = 2 nA. (C) An MSO neuron recorded in a brain slice from a gerbil aged P18 before and after 60 nM DTX-K was bath applied at 32°C. The signal was a modified sinusoid (the negative part of the sinusoid was multiplied by a factor of 0.5) with A s = 1.5 nA. The dotted lines are superimposed signals scaled to illustrate the response phase. (D) f-I curves of the phasic HH model obtained with white noise (σ = 100 pA/cm2) and low-pass filtered noise (σ = 500 pA/cm2). f, signal frequency. f cut, cutoff frequency of the low-pass filtered noise. Noise σ [in pA/cm2 in (A) and pA in (B) and (C)] is measured with the white noise before low-pass filtering.
Figure 11
Figure 11. An example of power-spectrum density (PSD).
Top, the signal (black) and the signal plus noise (gray). Middle, V m (solid) and the voltage level that identified a spike (dotted). Bottom, PSD for the tonic model in response to a 20-Hz signal (A = 0.2 nA) with white noise (σ = 5 pA). Pf, peak of the fundamental. Ph, peak of the first harmonic. Pbf, baseline for the fundamental. Pbh, baseline for the harmonic. Frequency resolution = 0.5 Hz. Total duration = 100 s. Only the first 100 ms of stimulus and response are shown in top and middle panels.

Similar articles

Cited by

References

    1. Longtin A. Stochastic resonance in neuron models. J Stat Phys. 1993;70:309–327.
    1. Moss F, Douglass JK, Wilkens L, Pierson D, Pantazelou E. Stochastic Resonance in an Electronic FitzHugh-Nagumo Model. In: Buchler JR, Kandrup HE, editors. Stochastic Processes in Astrophysics. New York: The New York Academy of Sciences; 1993. pp. 26–41.
    1. Braun HA, Wissing H, Schafer K, Hirsch MC. Oscillation and noise determine signal transduction in shark multimodal sensory cells. Nature. 1994;367:270–273. - PubMed
    1. Wiesenfeld K, Moss F. Stochastic resonance and the benefits of noise: from ice ages to crayfish and SQUIDs. Nature. 1995;373:33–36. - PubMed
    1. Cordo P, et al. Noise in human muscle spindles. Nature. 1996;383:769–770. - PubMed

Publication types