

Characterization of coastal urban watershed bacterial communities leads to alternative community-based indicators
- PMID: 20585654
- PMCID: PMC2890573
- DOI: 10.1371/journal.pone.0011285
Characterization of coastal urban watershed bacterial communities leads to alternative community-based indicators
Abstract
Background: Microbial communities in aquatic environments are spatially and temporally dynamic due to environmental fluctuations and varied external input sources. A large percentage of the urban watersheds in the United States are affected by fecal pollution, including human pathogens, thus warranting comprehensive monitoring.
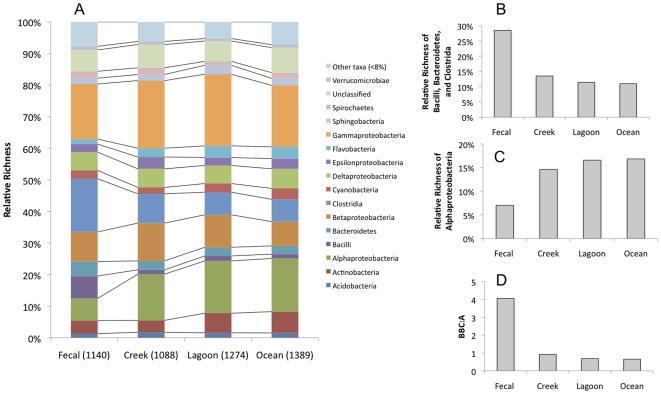
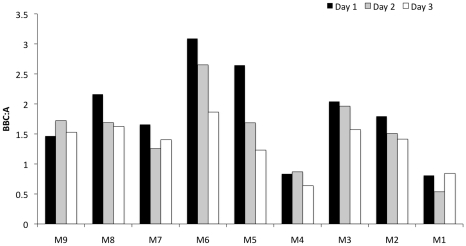
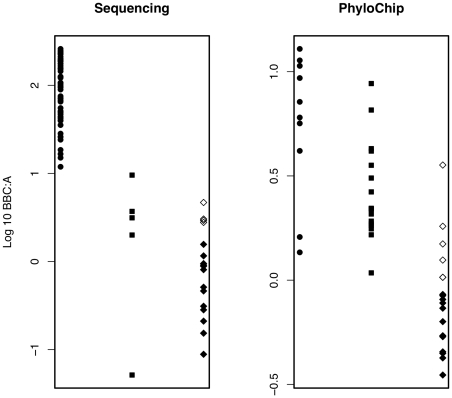
Methodology/principal findings: Using a high-density microarray (PhyloChip), we examined water column bacterial community DNA extracted from two connecting urban watersheds, elucidating variable and stable bacterial subpopulations over a 3-day period and community composition profiles that were distinct to fecal and non-fecal sources. Two approaches were used for indication of fecal influence. The first approach utilized similarity of 503 operational taxonomic units (OTUs) common to all fecal samples analyzed in this study with the watershed samples as an index of fecal pollution. A majority of the 503 OTUs were found in the phyla Firmicutes, Proteobacteria, Bacteroidetes, and Actinobacteria. The second approach incorporated relative richness of 4 bacterial classes (Bacilli, Bacteroidetes, Clostridia and alpha-proteobacteria) found to have the highest variance in fecal and non-fecal samples. The ratio of these 4 classes (BBC:A) from the watershed samples demonstrated a trend where bacterial communities from gut and sewage sources had higher ratios than from sources not impacted by fecal material. This trend was also observed in the 124 bacterial communities from previously published and unpublished sequencing or PhyloChip- analyzed studies.
Conclusions/significance: This study provided a detailed characterization of bacterial community variability during dry weather across a 3-day period in two urban watersheds. The comparative analysis of watershed community composition resulted in alternative community-based indicators that could be useful for assessing ecosystem health.
Conflict of interest statement
Figures
Similar articles
-
Human Fecal Contamination Corresponds to Changes in the Freshwater Bacterial Communities of a Large River Basin.Microbiol Spectr. 2021 Oct 31;9(2):e0120021. doi: 10.1128/Spectrum.01200-21. Epub 2021 Sep 8. Microbiol Spectr. 2021. PMID: 34494860 Free PMC article.
-
A microbial signature approach to identify fecal pollution in the waters off an urbanized coast of Lake Michigan.Microb Ecol. 2013 May;65(4):1011-23. doi: 10.1007/s00248-013-0200-9. Epub 2013 Mar 9. Microb Ecol. 2013. PMID: 23475306 Free PMC article.
-
Comparison of the microbial community structures of untreated wastewaters from different geographic locales.Appl Environ Microbiol. 2013 May;79(9):2906-13. doi: 10.1128/AEM.03448-12. Epub 2013 Feb 22. Appl Environ Microbiol. 2013. PMID: 23435885 Free PMC article.
-
Next-generation sequencing reveals fecal contamination and potentially pathogenic bacteria in a major inflow river of Taihu Lake.Environ Pollut. 2019 Nov;254(Pt B):113108. doi: 10.1016/j.envpol.2019.113108. Epub 2019 Aug 28. Environ Pollut. 2019. PMID: 31491696
-
Anthropogenic activity remains the main contributor to fecal pollution in managed tropical watersheds as unraveled by PhyloChip microarray-based microbial source tracking.J Hazard Mater. 2024 Jan 5;461:132474. doi: 10.1016/j.jhazmat.2023.132474. Epub 2023 Sep 4. J Hazard Mater. 2024. PMID: 37717440
Cited by
-
FEAST: fast expectation-maximization for microbial source tracking.Nat Methods. 2019 Jul;16(7):627-632. doi: 10.1038/s41592-019-0431-x. Epub 2019 Jun 10. Nat Methods. 2019. PMID: 31182859 Free PMC article.
-
Effects of nutrient loading on sediment bacterial and pathogen communities within seagrass meadows.Microbiologyopen. 2018 Oct;7(5):e00600. doi: 10.1002/mbo3.600. Epub 2018 Mar 9. Microbiologyopen. 2018. PMID: 29521006 Free PMC article.
-
Seasonal dynamics of bacterial community structure and function in the surf zone seawater of a recreational beach in Ostend, Belgium.Environ Microbiol Rep. 2024 Dec;16(6):e70031. doi: 10.1111/1758-2229.70031. Environ Microbiol Rep. 2024. PMID: 39513461 Free PMC article.
-
The microbiome of urban waters.Int Microbiol. 2015 Sep;18(3):141-9. doi: 10.2436/20.1501.01.244. Int Microbiol. 2015. PMID: 27036741 Free PMC article. Review.
-
Application of phylogenetic microarrays to interrogation of human microbiota.FEMS Microbiol Ecol. 2012 Jan;79(1):2-11. doi: 10.1111/j.1574-6941.2011.01222.x. Epub 2011 Nov 9. FEMS Microbiol Ecol. 2012. PMID: 22092522 Free PMC article. Review.
References
-
- UNEP. Marine and coastal ecosystems and human well-being: A synthesis report based on the findings of the Millennium Ecosystem Assessment. Nairobi, Kenya: United Nations Environmental Program; 2006. pp. 1–76.
-
- Platt RH. Urban watershed management: Sustainability, one stream at a time. Environment. 2006;48:38–38.
-
- USEPA. National Water Quality Inventory: Report to Congress, 2002 Reporting Cycle. 2007. US Environmental Protection Agency.
-
- Savichtcheva O, Okabe S. Alternative indicators of fecal pollution: Relations with pathogens and conventional indicators, current methodologies for direct pathogen monitoring and future application perspectives. Water Res. 2006;40:2463–2476. - PubMed
