

doi: 10.1021/nn901919w.
Gadolinium chloride augments tumor-specific imaging of targeted quantum dots in vivo
Affiliations
- PMID: 20586481
- PMCID: PMC3090730
- DOI: 10.1021/nn901919w
Item in Clipboard
Gadolinium chloride augments tumor-specific imaging of targeted quantum dots in vivo
ACS Nano.
.
Abstract
Nonspecific sequestration of nanoparticles by the reticulo-endothelial system (RES) results in the degradation of image quality of nanoparticle-based imaging. We demonstrate that gadolinium chloride (GdCl3) pretreatment inactivates RES macrophages, thereby increasing circulatory time and amplifying the tumor-specific signal of conjugated nanoparticles in vivo. The experimental results were validated using compartmental modeling, and the rate parameters for the observed kinetics pattern were estimated. This pretreatment strategy could have broad applicability across biomedical applications utilizing theranostic nanoparticles that are sequestered by the RES.
Figures
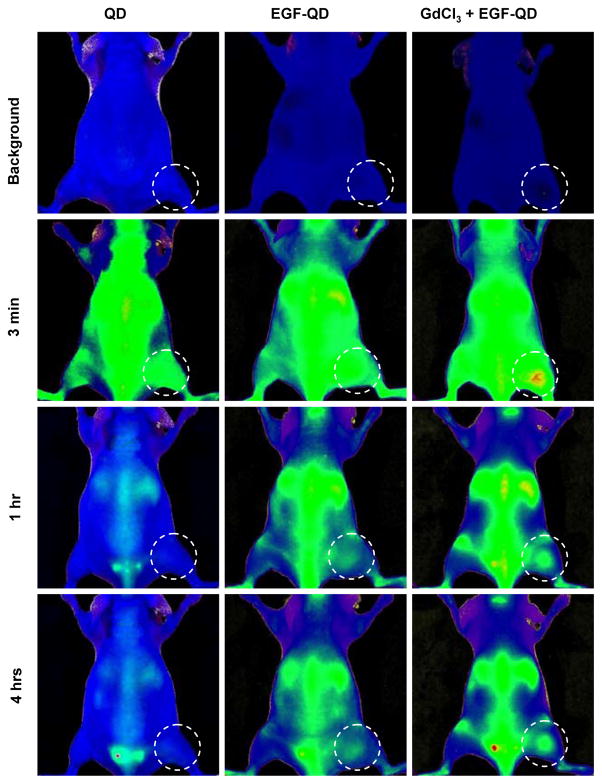
In vivo fluorescence images of animals at 0 h (“Background”), 3 min, 1 h, and 4 h after intravenous injection of QD, EGF-QD, or GdCl3 pretreatment followed by EGF-QD.
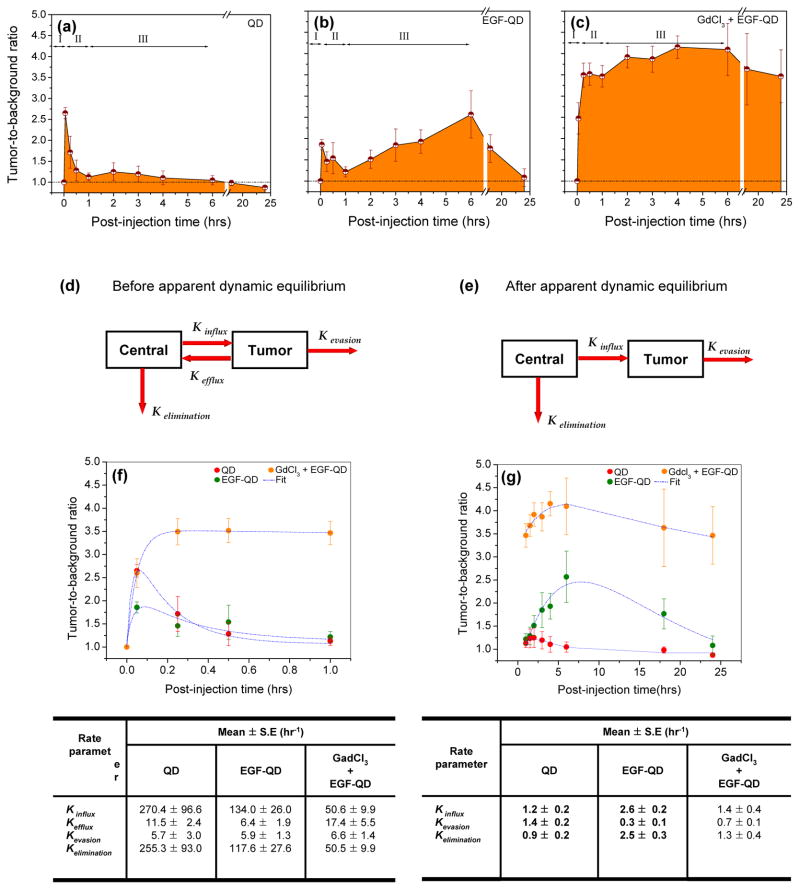
Estimated mean tumor-to-background ratios (mean ± SE) from animals injected with (a) QD, (b) EGF-QD, or (c) GdCl3 followed by EGF-QD. The three phases of influx, efflux, and accumulation are represented as I, II, and III, respectively. Based on the observed kinetic pattern, a two-compartment model was proposed to estimate the kinetic rate parameters (d) before and (e) after apparent dynamic equilibrium. The two-compartment model fit (blue dotted lines) to the tumor-to-background ratios before and after dynamic equilibrium is illustrated in (f) and (g), respectively, with the corresponding rate parameters represented in tables below the figures.
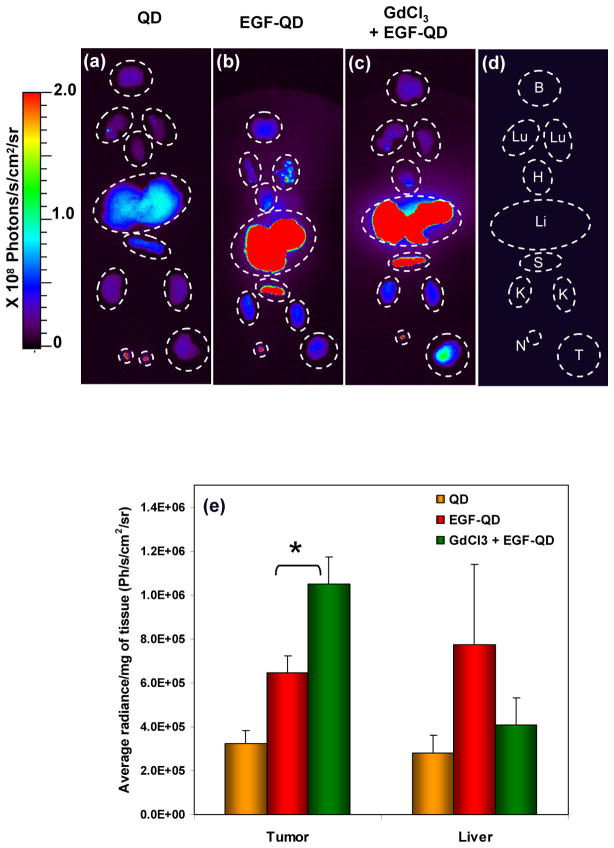
Ex vivo fluorescence images of organs harvested 4 h after (a) QD injection, (b) EGF-QD injection, and (c) GdCl3 pretreatment followed by EGF-QD injection. (d) A cartoon representing the arrangement of organs where B, Lu, H, Li, S, K, N, and T represent the brain, lungs, heart, liver, spleen, kidney, lymph node, and tumor, respectively. The corresponding fluorescence levels (mean ± SE) from the extracts of tumor and liver tissues are represented in (e), where * represents the statistical significance (p < 0.001) based on an unpaired Student’s t test.
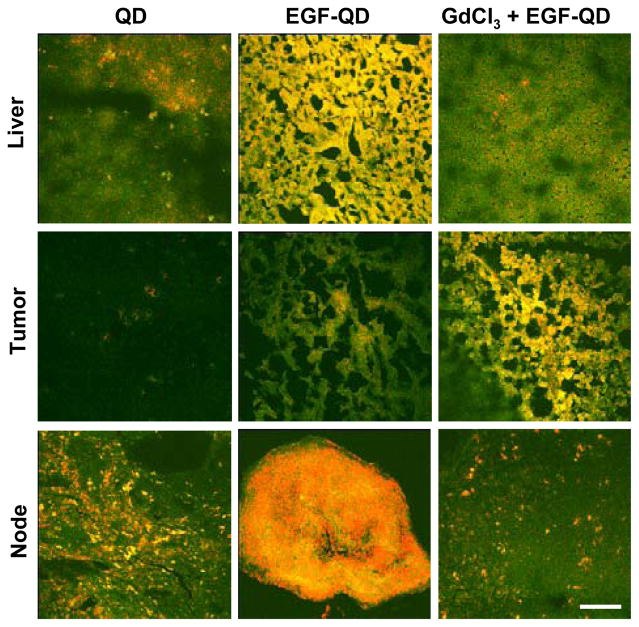
Fluorescence confocal images of frozen liver, tumor, and lymph node extracted 4 h after QD injection, EGF-QD injection, and GdCl3 pretreatment followed by EGF-QD injection. Green represents autofluorescence, and red represents QD fluorescence. (Scale bar = 50 μm).
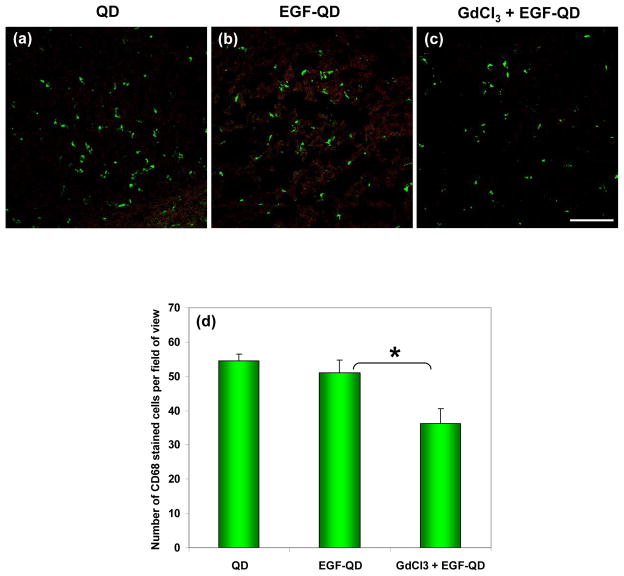
Activated Kupffer cell–specific anti-CD68 immunofluorescence staining of liver tissues extracted 4 h after (a) QD injection, (b) EGF-QD injection, and (c) GdCl3 pretreatment followed by EGF-QD injection. Green represents CD68 staining, and red represents QD fluorescence. (Scale bar = 50 μm). (d) Quantified CD-68 stained activated Kupffer cells in the liver tissues from each group averaged over different field of views (n=7) shows statistically significant (p < 0.001) difference with and without GdCl3 pretreatment.
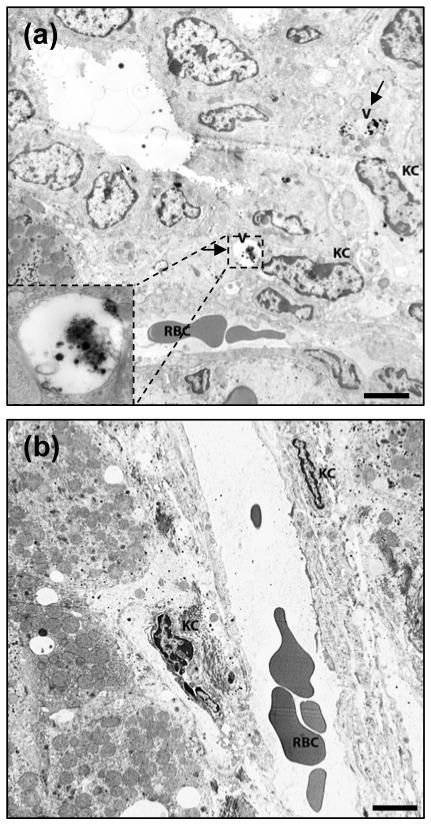
Transmission electron microscopy image of liver tissue extracted 4 h after (a) EGF-QD injection and (b) GdCl3 pretreatment followed by EGF-QD injection. The arrows in (a) represent the accumulation of QDs in the endocytotic vesicles within the Kupffer cells, and the insert represents the enlarged version of the vesicles containing the QDs. The labels V, KC, and RBC represent the vesicles, Kupffer cells, and red blood cells, respectively. (Scale bar = 5 μm).
Similar articles
-
Delayed hepatic signal recovery on ferucarbotran-enhanced magnetic resonance images: an experimental study in rat livers with gadolinium chloride-induced Kupffer cell damage.MAGMA. 2013 Jun;26(3):313-24. doi: 10.1007/s10334-012-0354-3. Epub 2012 Nov 2. MAGMA. 2013. PMID: 23117343
-
Suppression of Kupffer cell function prevents cadmium induced hepatocellular necrosis in the male Sprague-Dawley rat.Toxicology. 1997 Aug 15;121(2):155-64. doi: 10.1016/s0300-483x(97)00062-0. Toxicology. 1997. PMID: 9230447
-
Gadolinium chloride reduces cytochrome P450: relevance to chemical-induced hepatotoxicity.Toxicology. 1997 Aug 15;121(2):143-53. doi: 10.1016/s0300-483x(97)00065-6. Toxicology. 1997. PMID: 9230446
-
Quantum dots in cell biology.J Histochem Cytochem. 2011 Mar;59(3):237-51. doi: 10.1369/0022155411398487. J Histochem Cytochem. 2011. PMID: 21378278 Free PMC article. Review.
-
Delivering quantum dots to cells: bioconjugated quantum dots for targeted and nonspecific extracellular and intracellular imaging.Chem Soc Rev. 2010 Aug;39(8):3031-56. doi: 10.1039/b926512k. Epub 2010 May 27. Chem Soc Rev. 2010. PMID: 20508886 Review.
Cited by
-
Thirty Years of Cancer Nanomedicine: Success, Frustration, and Hope.Cancers (Basel). 2019 Nov 25;11(12):1855. doi: 10.3390/cancers11121855. Cancers (Basel). 2019. PMID: 31769416 Free PMC article. Review.
-
Sphingosine kinase 1 regulates HMGB1 translocation by directly interacting with calcium/calmodulin protein kinase II-δ in sepsis-associated liver injury.Cell Death Dis. 2020 Dec 6;11(12):1037. doi: 10.1038/s41419-020-03255-6. Cell Death Dis. 2020. PMID: 33281190 Free PMC article.
-
A Nanoparticle's Journey to the Tumor: Strategies to Overcome First-Pass Metabolism and Their Limitations.Cancers (Basel). 2022 Mar 29;14(7):1741. doi: 10.3390/cancers14071741. Cancers (Basel). 2022. PMID: 35406513 Free PMC article. Review.
-
Pancreatic tumor microenvironmental acidosis and hypoxia transform gold nanorods into cell-penetrant particles for potent radiosensitization.Sci Adv. 2022 Nov 11;8(45):eabm9729. doi: 10.1126/sciadv.abm9729. Epub 2022 Nov 11. Sci Adv. 2022. PMID: 36367938 Free PMC article.
-
Advanced strategies to evade the mononuclear phagocyte system clearance of nanomaterials.Exploration (Beijing). 2023 Jan 5;3(1):20220045. doi: 10.1002/EXP.20220045. eCollection 2023 Feb. Exploration (Beijing). 2023. PMID: 37323617 Free PMC article. Review.
References
-
- Debbage P, Jaschke W. Molecular Imaging with Nanoparticles: Giant Roles for Dwarf Actors. Histochem Cell Biol. 2008;130:845–875. - PubMed
-
- Zhang H, Yee D, Wang C. Quantum Dots for Cancer Diagnosis and Therapy: Biological and Clinical Perspectives. Nanomed. 2008;3:83–91. - PubMed
-
- Bruchez M, Jr, Moronne M, Gin P, Weiss S, Alivisatos AP. Semiconductor Nanocrystals as Fluorescent Biological Labels. Science. 1998;281:2013–2016. - PubMed
-
- Alivisatos P. The Use of Nanocrystals in Biological Detection. Nat Biotechnol. 2004;22:47–52. - PubMed
Publication types
MeSH terms
Substances
Grants and funding
LinkOut - more resources
Full Text Sources
