. 2010 Sep 1;34(9):1552-64.
doi: 10.1111/j.1530-0277.2010.01240.x. Epub 2010 Jun 25.

Withdrawal severity after chronic intermittent ethanol in inbred mouse strains

Affiliations

Withdrawal severity after chronic intermittent ethanol in inbred mouse strains

Pamela Metten et al. Alcohol Clin Exp Res. .

Abstract

Background: To study withdrawal, ethanol is usually administered chronically without interruption. However, interest has recurred in models of episodic exposure. Increasing evidence suggests that chronic intermittent exposure to ethanol leads to a sensitization effect in both withdrawal severity and ethanol consumption. The goal of the present study was to examine mouse inbred strain differences in withdrawal severity following chronic intermittent exposure using the handling-induced convulsion as the behavioral endpoint. We also sought to compare the withdrawal responses of inbred strains across acute, chronic continuous, and chronic intermittent exposure regimens.

Methods: Male mice from 15 standard inbred strains were exposed to ethanol vapor for 16 hours each day for 3 days and removed to an air chamber during the intervening 8 hours. Mice in the control groups were handled the same, except that they were exposed only to air. Daily blood ethanol concentrations were averaged for each mouse to estimate total dose of ethanol experienced.

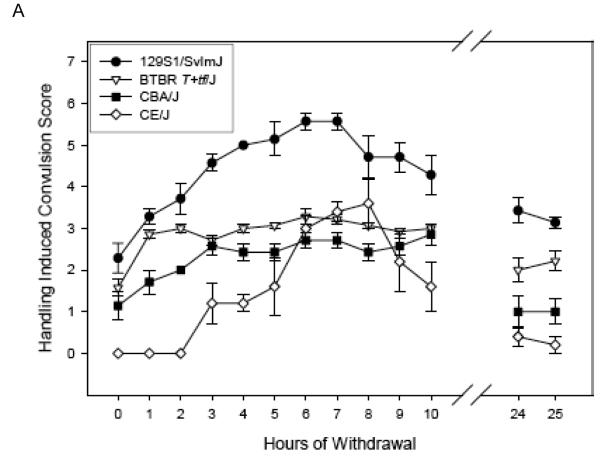
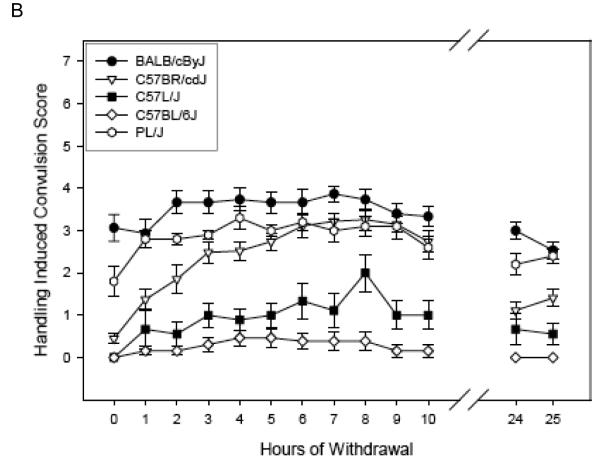
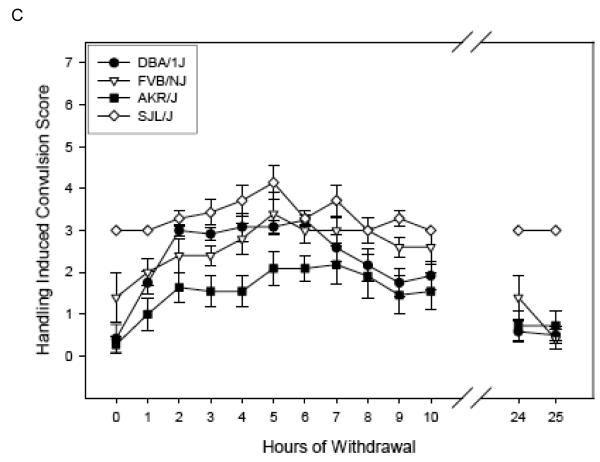
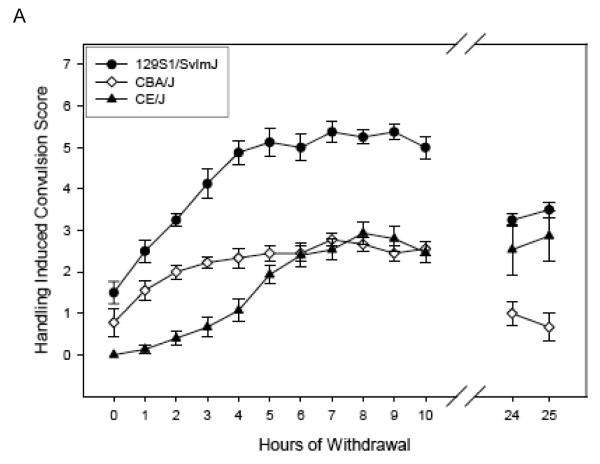
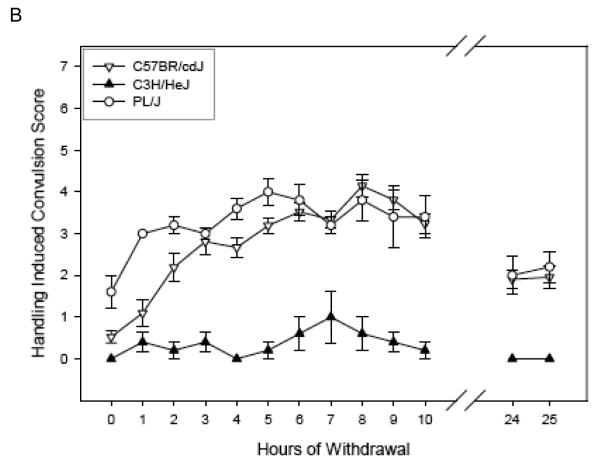
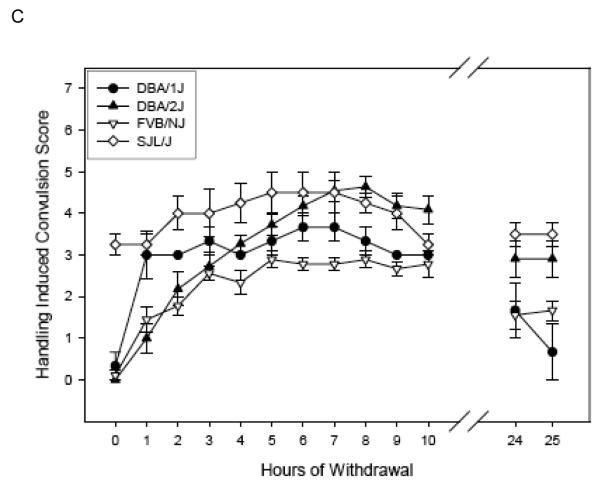
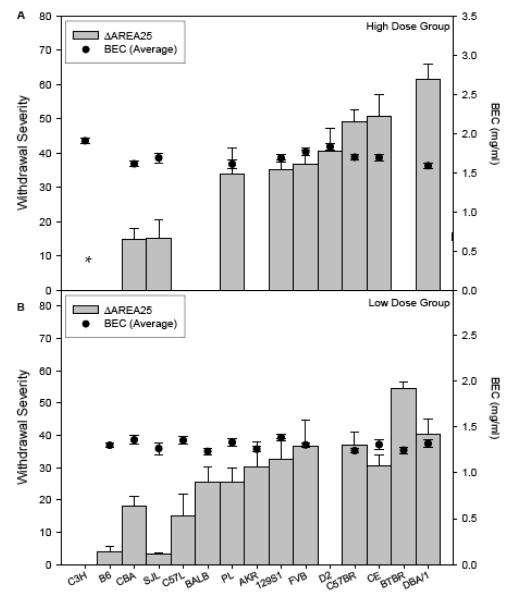
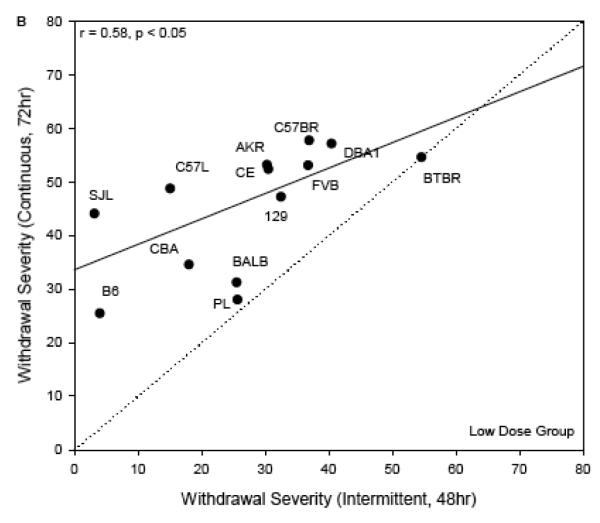
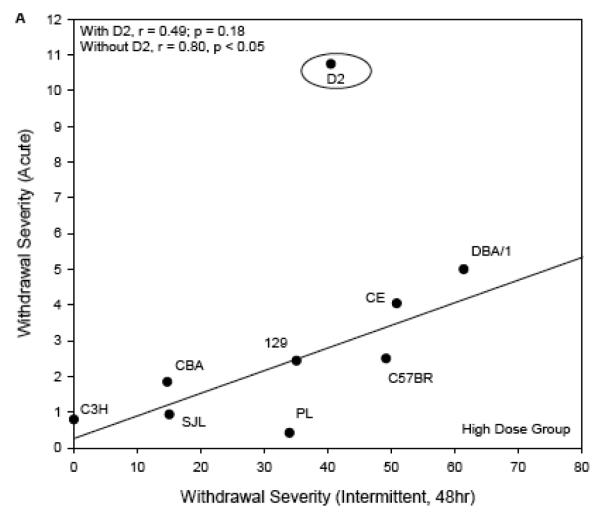
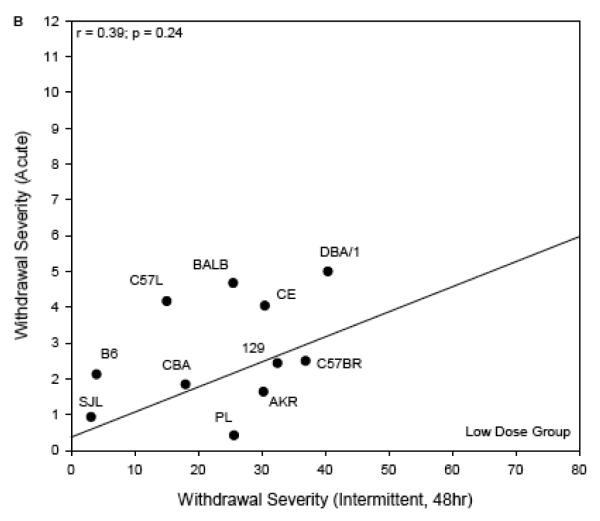
Results: Across strains, mice had an average daily blood ethanol concentration (BEC) of 1.45 +/- 0.02 mg/ml and we restricted the range of this value to 1.00-2.00 mg/ml. To evaluate strain differences, we divided data into two dose groups based on BEC, low dose (1.29 +/- 0.1 mg/ml) and high dose (1.71 +/- 0.02 mg/ml). After the third inhalation exposure, ethanol-exposed and air-exposed groups were tested hourly for handling-induced convulsions for 10 hour and at hour 24 and 25. Strains differed markedly in the severity of withdrawal (after subtraction of air control values) in both dose groups.

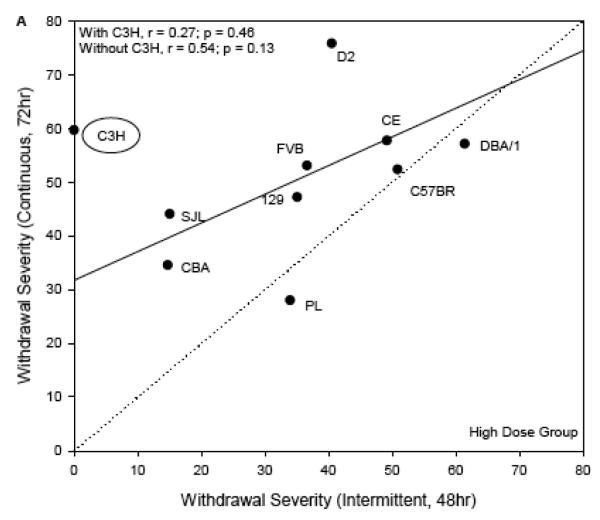
Conclusion: The chronic intermittent exposure paradigm is sufficient to elicit differential withdrawal responses across nearly all strains. Data from the high-dose groups correlated well with withdrawal data derived from prior acute (single high dose) and chronic continuous (for 72 hours) ethanol withdrawal studies, supporting the influence of common genes on all three responses.


Figures

Figure 1
Figure 1
(Panels A-C). Mean ± SE hourly HIC scores during withdrawal for Low Dose ethanol-treated groups. Number of mice/strain is given in Table 2. Data from air-treated groups are presented in Table 4. The panel in which a strain is depicted is arbitrary.
Figure 1
Figure 1
(Panels A-C). Mean ± SE hourly HIC scores during withdrawal for Low Dose ethanol-treated groups. Number of mice/strain is given in Table 2. Data from air-treated groups are presented in Table 4. The panel in which a strain is depicted is arbitrary.
Figure 1
Figure 1
(Panels A-C). Mean ± SE hourly HIC scores during withdrawal for Low Dose ethanol-treated groups. Number of mice/strain is given in Table 2. Data from air-treated groups are presented in Table 4. The panel in which a strain is depicted is arbitrary.
Figure 2
Figure 2
(Panels A-C). Mean ± SE hourly HIC scores during withdrawal for High Dose ethanol-treated groups. Number of mice/strain is given in Table 2. Data from air-treated groups are presented in Table 4. Panel – strain combinations are the same as in Figure 1.
Figure 2
Figure 2
(Panels A-C). Mean ± SE hourly HIC scores during withdrawal for High Dose ethanol-treated groups. Number of mice/strain is given in Table 2. Data from air-treated groups are presented in Table 4. Panel – strain combinations are the same as in Figure 1.
Figure 2
Figure 2
(Panels A-C). Mean ± SE hourly HIC scores during withdrawal for High Dose ethanol-treated groups. Number of mice/strain is given in Table 2. Data from air-treated groups are presented in Table 4. Panel – strain combinations are the same as in Figure 1.
Figure 3
Figure 3
Strain mean withdrawal severity after chronic intermittent ethanol exposure at two exposure levels. Significant withdrawal was shown by all strains except for C3H/HeJ, as discussed in the text. Note that not all strains were included in each dose group. For computation of ΔAREA25, see results. Panel A: High Dose group strain mean ± SE withdrawal severity scores (ΔAREA25) are shown (Left ordinate). Also shown is the mean BEC ± SE, averaged over the three daily values (Right ordinate). * The ΔAREA25 score for C3H/HeJ was corrected to zero as shown in Table 4. Panel B: Low Dose group strain mean ± SE withdrawal severity scores (ΔAREA25) are shown (Left ordinate). Also shown is the mean BEC ± SE, averaged over the three daily values (Right ordinate).
Figure 4
Figure 4
Withdrawal severity in the current experiment (ΔAREA25, abscissa), plotted versus comparable data following chronic continuous vapor inhalation for 72 hr (ordinate; Metten & Crabbe, 2005). Each point represents a strain mean value. The regression lines (solid line) and one-to-one lines (dotted line) are shown. Panel A: High Dose chronic intermittent exposure. The regression line shown was computed without the C3H/HeJ strain as discussed in the text. Panel B: Low Dose chronic intermittent exposure.
Figure 4
Figure 4
Withdrawal severity in the current experiment (ΔAREA25, abscissa), plotted versus comparable data following chronic continuous vapor inhalation for 72 hr (ordinate; Metten & Crabbe, 2005). Each point represents a strain mean value. The regression lines (solid line) and one-to-one lines (dotted line) are shown. Panel A: High Dose chronic intermittent exposure. The regression line shown was computed without the C3H/HeJ strain as discussed in the text. Panel B: Low Dose chronic intermittent exposure.
Figure 5
Figure 5
Withdrawal severity in the current experiment (ΔAREA25, abscissa), plotted versus comparable data following a single 4 g/kg ip injection of ethanol (ordinate; Metten & Crabbe, 1994). Each point represents a strain mean value. The regression lines are shown. One-to-one lines are not shown because the time course for acute withdrawal testing differs from that following chronic intermittent exposure. Panel A: High Dose chronic intermittent exposure. The regression line shown was computed without the DBA/2J strain as discussed in the text. Panel B: Low Dose chronic intermittent exposure.
Figure 5
Figure 5
Withdrawal severity in the current experiment (ΔAREA25, abscissa), plotted versus comparable data following a single 4 g/kg ip injection of ethanol (ordinate; Metten & Crabbe, 1994). Each point represents a strain mean value. The regression lines are shown. One-to-one lines are not shown because the time course for acute withdrawal testing differs from that following chronic intermittent exposure. Panel A: High Dose chronic intermittent exposure. The regression line shown was computed without the DBA/2J strain as discussed in the text. Panel B: Low Dose chronic intermittent exposure.

References

    1. Ballenger JC, Post RM. Kindling as a model for alcohol withdrawal syndromes. Br J Psychiatry. 1978;133:1–14. - PubMed
    1. Becker HC. Positive relationship between the number of prior ethanol withdrawal episodes and the severity of subsequent withdrawal seizures. Psychopharmacology. 1994;116:26–32. - PubMed
    1. Becker HC, Diaz-Granados JL, Hale RL. Exacerbation of ethanol withdrawal seizures in mice with a history of multiple withdrawal experience. Pharmacology Biochemistry and Behavior. 1997a;57(1/2):179–183. - PubMed
    1. Becker HC, Diaz-Granados JL, Weathersby RT. Repeated ethanol withdrawal experience increases the severity and duration of subsequent withdrawal seizures in mice. Alcohol. 1997b;14(4):319–326. - PubMed
    1. Becker HC, Hale RL. Repeated episodes of ethanol withdrawal potentiate the severity of subsequent withdrawal seizures: An animal model of alcohol withdrawal “kindling.”. Alcohol Clin.Exp.Res. 1993;17:94–98. - PubMed

Publication types