. 2011 Jun;15(6):1287-98.
doi: 10.1111/j.1582-4934.2010.01113.x. Epub 2010 Jun 25.

Generation of easily accessible human kidney tubules on two-dimensional surfaces in vitro

Affiliations

Generation of easily accessible human kidney tubules on two-dimensional surfaces in vitro

Huishi Zhang et al. J Cell Mol Med. 2011 Jun.

Abstract

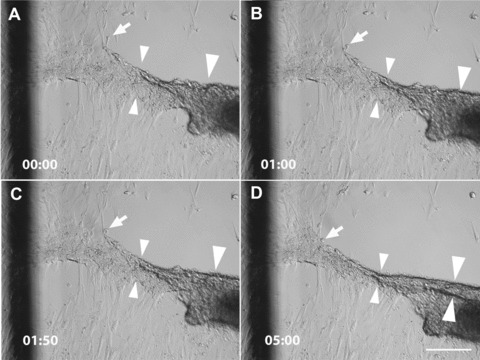
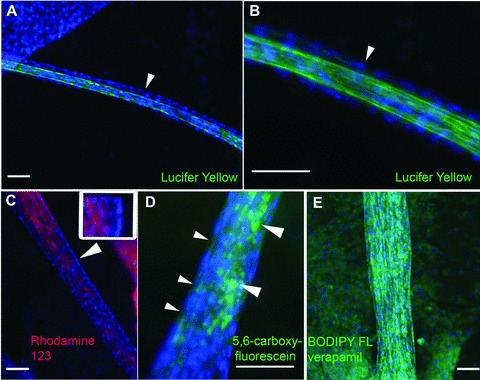
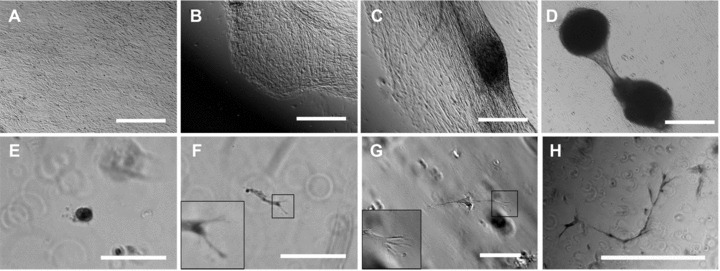
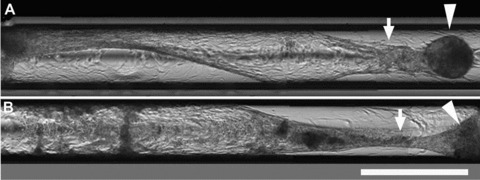
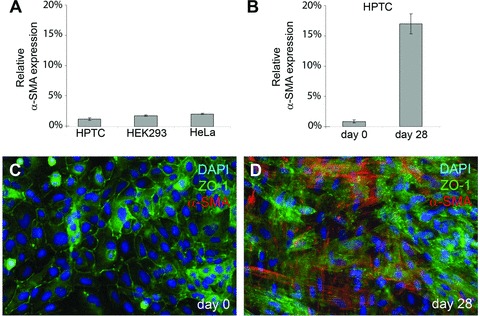
The generation of tissue-like structures in vitro is of major interest for various fields of research including in vitro toxicology, regenerative therapies and tissue engineering. Usually 3D matrices are used to engineer tissue-like structures in vitro, and for the generation of kidney tubules, 3D gels are employed. Kidney tubules embedded within 3D gels are difficult to access for manipulations and imaging. Here we show how large and functional human kidney tubules can be generated in vitro on 2D surfaces, without the use of 3D matrices. The mechanism used by human primary renal proximal tubule cells for tubulogenesis on 2D surfaces appears to be distinct from the mechanism employed in 3D gels, and tubulogenesis on 2D surfaces involves interactions between epithelial and mesenchymal cells. The process is induced by transforming growth factor-β(1), and enhanced by a 3D substrate architecture. However, after triggering the process, the formation of renal tubules occurs with remarkable independence from the substrate architecture. Human proximal tubules generated on 2D surfaces typically have a length of several millimetres, and are easily accessible for manipulations and imaging, which makes them attractive for basic research and in vitro nephrotoxicology. The experimental system described also allows for in vitro studies on how primary human kidney cells regenerate renal structures after organ disruption. The finding that human kidney cells organize tissue-like structures independently from the substrate architecture has important consequences for kidney tissue engineering, and it will be important, for instance, to inhibit the process of tubulogenesis on 2D surfaces in bioartificial kidneys.


Figures

Fig 1
Fig 1
The process of tubule formation on 2D surfaces. (A)–(D) and (H) show images obtained by epifluorescence microscopy after immunodetection of zonula occludens-1 (ZO-1) (green) and α-SMA (red). Nuclei were counterstained with 4′,6′-diamidino-2′-phenylindole (DAPI) (blue). The other panels show images obtained by (E, F) differential interference contrast microscopy and (G) bright-field microscopy. In all cases, the HPTCs were cultured on the bottom of the wells of 24-well plates. (A) First, a well-differentiated epithelial monolayer is formed. (B) Subsequently, myofibroblast aggregates that are strongly positive for α-SMA appear. (C, E) The monolayer then retracts on the one side of the myofibroblast aggregates, leaving a surface devoid of cells (left half in C). (D, F) The monolayer subsequently retracts on the other side of the myofibroblast aggregates. This leads to the formation of cell stripes, which include myofibroblast aggregates (note: myofibroblast aggregates are labelled with arrowheads in E, F and G). (G, H) Finally, large renal tubules are formed on the 2D surface. Several images were stitched together in order to cover the entire tubule shown in (G). Scale bars: (A) 100 μm, (B–F, H) 200 μm, and (G) 1 mm.
Fig 3
Fig 3
Tubules have a lumen lined by a differentiated epithelium. (A) Cross-section and (B) longitudinal section of a tubule. Tubules were stained with DAPI (white). (C) The surface of a tubule is imaged by epifluorescence microscopy (the upper right areas are out of focus). ZO-1 (white) is detected by immunofluorescence. The tubular epithelium shows extensive formation of tight junctions, as indicated by the chicken wire-like ZO-1 patterns. (D) γGTP activity is detected histochemically. Higher levels of γGTP activity result in the darker staining of cells. The image shows high levels of γGTP activity in a tubule, whereas the monolayer cells below display lower levels of activity of this brush border enzyme. Scale bars: (A–C) 100 μm and (D) 200 μm.
Fig 2
Fig 2
Tubule formation is associated with rapid cell movements. The panels show the same area imaged by differential interference contrast microscopy at consecutive time-points (minutes and seconds are indicated in the lower left corner). The images show living HPTCs in cell culture medium on the bottom of a well of a 24-well plate. The imaged area contains part of a myofibroblast aggregate (right edge). The monolayer has already retracted on one side of the myofibroblast aggregate (note that the upper right area is devoid of cells). Cells are in the process of retracting from the other side and folding up the cell stripe into a tubule. The cell stripe is substantially narrowed over the period of 5 min., as indicated for one region marked by the small arrowheads. A tubule-like structure with two clear borders (large arrowheads) is visible at the end of the observation period, but not at the previous time-points. Thus, this structure and its lower border (marked by the lower large arrowhead) are formed in ∼5 min. Cells at the borders of the stripe (marked by arrow) are quickly integrated into the tubule that is being formed. The dark line on the left side of the panels belongs to a grid, which has been drawn on the outer surface of the well bottom to facilitate spatial orientation during the imaging of cell movements. Scale bar: 200 μm.
Fig 4
Fig 4
Organic anion transport. Human proximal tubules formed on 2D surfaces are incubated for 20 hrs with the organic anions lucifer yellow (A, B; green), rhodamine 123 (C; red), 5,6-carboxyfluorescein (D; green) and BODIPY FL verapamil (E; green). Tubules are fixed before imaging, and the cell nuclei are counterstained with DAPI (blue). Part (B) shows an enlarged sector of the tubule displayed in (A). The arrowhead points to the outer layer of cells lining the tubular lumen, which displays only faint lucifer yellow fluorescence. By contrast, the lumen is strongly labelled. (C) Rhodamine 123 is enriched in the tubular lumen, as compared to the outer layer of cells. The arrowhead points to a region that is enlarged in the inset. The DAPI-stained nuclei of the outer cell layer are on the right in the inset. The cytoplasm displays only very faint rhodamine 123 fluorescence, which is enriched in the tubular lumen (on the left in the inset). (D) The small arrowheads point to the cytoplasm between the DAPI-stained nuclei of the outer cell layer. The cytoplasm displays only faint 5,6-carboxyfluorescein fluorescence. 5,6-carboxyfluorescein is enriched in the tubular interior (large arrowheads). (E) BODIPY FL verapamil is enriched in the cytoplasm of tubular and monolayer cells. Scale bars: 100 μm.
Fig 5
Fig 5
Tubule formation by HPTCs on 2D surfaces and in 3D gels. (A)–(D) show tubule formation by HPTCs growing on matrigel-coated bottoms of 24-well plate wells. (A) First, a confluent monolayer is formed. (B) Subsequently, the monolayer retracts on one side. (C) Then the monolayer retracts on both sides of a myofibroblast aggregate. (D) Finally, a tubule attached to myofibroblast aggregates is formed. The process is similar to that shown in Figure 1. (E)–(H) show tubule formation by HPTCs suspended in matrigel. (E) Initially, single cells or small groups of cells are present. Note that most of these structures distributed in the 3D gel are out of focus, if a given field is imaged and appear as blurred rings on the images. (F, G) Cell outgrowth occurs (no cyst formation before cell outgrowth), leading to the formation of elongated cords or tubules. The tip cells are typically branched and display multiple filopodia (shown as enlarged in the insets; the branched cell shown in (F) appears blurred due to problems with imaging these structures within the gel). (H) Finally, thin tubules displaying multiple branches are formed. The size of tubules formed in matrigel is typically less than 1 mm, and the tubules are not attached to myofibroblast aggregates (note the different morphology of the structures shown in D and H). Scale bars: (A–D) 1 mm, (E–G) 100 μm and (H) 500 μm.
Fig 6
Fig 6
Sensing of a 3D edge triggers tubulogenesis. (A and B) show two wells of 24-well plates with HPTCs. Multiple tubules with attached myofibroblast aggregates (two of these structures are marked by arrows) are present within these wells (well diameter = 15 mm). The tubules always display a similar distance from the edge, which leads to the generation of ring-like structures consisting of tubules. (C and D) show initial retraction of the monolayer starting at the edge the wells. Uneven illumination is due to optical effects at the edge. The direction where the edge is located is indicated by large arrowheads, and part of the edge is visible in the upper right corner in (C). A part of the monolayer is visible in the lower left corner in (C). All cells of the monolayer moved simultaneously from the edge towards the centre, leaving an almost void surface behind. (D) shows a cell layer that retracted from the edge. Here, coordinated retraction from the opposite side has started, which breaks up the cell layer (marked by small arrowheads) at defined distances from the outer rim. Scale bars: (A, B) 3 mm and (C, D) 500 μm.
Fig 7
Fig 7
Triggering of tubulogenesis in the presence of a 3D substrate architecture. HPTCs were grown to confluency on glass cover slips (A, D and G), in the wells of 24-well plates consisting of tissue culture plastic (B, E and H), and in the wells of diagnostic printed slides (C, F and I). Cover slips with a side length of 18 mm are used. The wells of 24-well plates and diagnostic printed slides are 15 mm and 2 mm in diameter, respectively. Cells on the different devices are monitored over a time period of 8 days. (A)–(C) show the confluent monolayers at day 2. The edges of the different substrates used are indicated by large arrowheads. (E, F) Monolayer retraction starts at day 3 at the edges of the wells (marked by large arrowheads) of 24-well plates and diagnostic printed slides. This leads to areas devoid of cells (marked by a small arrowhead in F). No rearrangements are observed at (D) day 3 and (G) day 8 at the edges of cover slips (marked by large arrowheads), which do not have a 3D structure. The monolayer is still intact on cover slips. By contrast, major rearrangements are noted at day 8 in the wells of (H) 24-well plates and (I) diagnostic printed slides. Formation of tubules (marked by small arrowhead in H) and myofibroblast aggregates (marked by small arrowhead in I) is observed. The wells of 24-well plates and diagnostic printed slides provide different surface chemistries and surface areas. However, in both cases, the edge is a 3D structure, in contrast to the edge of cover slips. Scale bar: 500 μm.
Fig 8
Fig 8
Tubulogenesis in capillaries. HPTCs are seeded into glass capillaries with an inner diameter of 580 μm. (A) and (B) show two different capillaries containing HPTCs imaged ∼2 weeks after seeding. Several images were stitched together in order to cover a larger area. Initially after seeding, monolayers covering the inner walls of the capillaries are formed. The monolayer is still intact in the left half of the lower capillary (B). Myofibroblast aggregates appear after monolayer formation. The monolayer is then rearranged and detached from the capillary walls, and tubules are formed within the capillaries (marked by arrows), which are attached to myofibroblast aggregates (marked by arrowheads). Scale bar: 1 mm.
Fig 9
Fig 9
α-SMA expression in initial and 4-week-old cultures of HPTCs. (A) The expression levels of α-SMA (relative to GAPDH, average ± S.D.) were determined by qRT-PCR in initial cultures of HPTCs. These initial cultures contained cells freshly seeded from the vial obtained from the vendor, and the cells had not been passaged before analysis. The analysis was performed as soon as an epithelial sheet had been formed. For comparison, similar qRT-PCR analyses were also performed with confluent monolayer cultures of HEK293 and HeLa cells, and the results are shown. (B) α-SMA expression (relative to GAPDH, average ± S.D.) was determined by qRT-PCR in initial cultures of HPTCs (day 0) and 28 days later in cultures that were seeded in parallel. The cultures were not passaged during this time period, but the medium was regularly exchanged. (C) The image shows an initial culture of HPTCs (day 0) after co-immunostaining (ZO-1: green, α-SMA: red, DAPI: blue). α-SMA was not detectable. (D) The same co-immunostaining procedure was performed after 28 days with cultures seeded in parallel. Many α-SMA-expressing cells are present.
Fig 10
Fig 10
Growth factor expression and effects of TGF-β1. (A) The expression levels of TGF-β1, α-SMA, leukaemia inhibitory factor, fibroblast growth factor 2, keratinocyte growth factor and hepatocyte growth factor are monitored over a period of 4 weeks. The expression levels are determined by quantitative RT-PCR, and displayed as percentages of GAPDH expression. The five different bars displayed for each factor show the relative expression levels (average ± S.D.) at day 1 (week 0) and at weeks 1–4 after seeding. Results that are significantly different (P < 0.05) from the data obtained at day 1 are marked with an asterisk. Results that are significantly different (P < 0.05) from the data obtained at day 1 and at week 1 are marked with two asterisks. (B)–(D) show the cells treated for 3 days with 10 ng/ml of TGF-β1 after monolayer formation. TGF-β1 treatment induced rearrangements leading to the formation of condensed stripes of cells and areas devoid of cells (B, D). (C) shows a cell aggregate. (E) displays the untreated control cells, whereby the intact monolayer is maintained. Scale bar: 500 μm.

References

    1. Dressler G. Tubulogenesis in the developing mammalian kidney. Trends Cell Biol. 2002;12:390–5. - PubMed
    1. Vainio S, Lin Y. Coordinating early kidney development: lessons from gene targeting. Nat Rev Genet. 2002;3:533–43. - PubMed
    1. Han HJ, Sigurdson WJ, Nickerson PA, et al. Both mitogen activated protein kinase and the mammalian target of rapamycin modulate the development of functional renal proximal tubules in matrigel. J Cell Sci. 2004;117:1821–33. - PubMed
    1. Humes HD, Krauss JC, Cieslinski DA, et al. Tubulogenesis from isolated single cells of adult mammalian kidney: clonal analysis with a recombinant retrovirus. Am J Physiol. 1996;271:F42–9. - PubMed
    1. Karihaloo A, Nickel C, Cantley LG. Signals which build a tubule. Nephron Exp Nephrol. 2005;100:e40–5. - PubMed

Publication types

MeSH terms