. 2010 Jun 29:11:51.
doi: 10.1186/1471-2199-11-51.

Characterization of the human Activin-A receptor type II-like kinase 1 (ACVRL1) promoter and its regulation by Sp1

Affiliations

Characterization of the human Activin-A receptor type II-like kinase 1 (ACVRL1) promoter and its regulation by Sp1

Eva M Garrido-Martin et al. BMC Mol Biol. .

Abstract

Background: Activin receptor-like kinase 1 (ALK1) is a Transforming Growth Factor-beta (TGF-beta) receptor type I, mainly expressed in endothelial cells that plays a pivotal role in vascular remodelling and angiogenesis. Mutations in the ALK1 gene (ACVRL1) give rise to Hereditary Haemorrhagic Telangiectasia, a dominant autosomal vascular dysplasia caused by a haploinsufficiency mechanism. In spite of its patho-physiological relevance, little is known about the transcriptional regulation of ACVRL1. Here, we have studied the different origins of ACVRL1 transcription, we have analyzed in silico its 5'-proximal promoter sequence and we have characterized the role of Sp1 in the transcriptional regulation of ACVRL1.

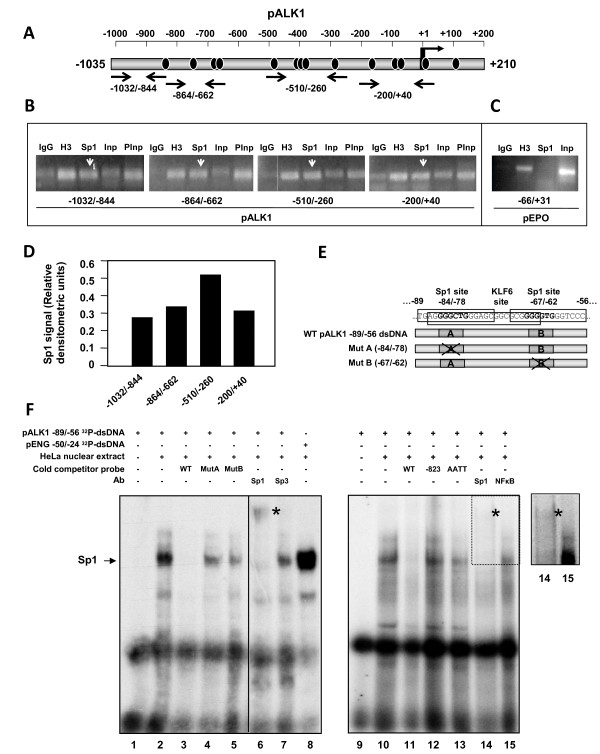
Results: We have performed a 5'Rapid Amplification of cDNA Ends (5'RACE) of ACVRL1 transcripts, finding two new transcriptional origins, upstream of the one previously described, that give rise to a new exon undiscovered to date. The 5'-proximal promoter region of ACVRL1 (-1,035/+210) was analyzed in silico, finding that it lacks TATA/CAAT boxes, but contains a remarkably high number of GC-rich Sp1 consensus sites. In cells lacking Sp1, ACVRL1 promoter reporters did not present any significant transcriptional activity, whereas increasing concentrations of Sp1 triggered a dose-dependent stimulation of its transcription. Moreover, silencing Sp1 in HEK293T cells resulted in a marked decrease of ACVRL1 transcriptional activity. Chromatin immunoprecipitation assays demonstrated multiple Sp1 binding sites along the proximal promoter region of ACVRL1 in endothelial cells. Furthermore, demethylation of CpG islands, led to an increase in ACVRL1 transcription, whereas in vitro hypermethylation resulted in the abolishment of Sp1-dependent transcriptional activation of ACVRL1.

Conclusions: Our results describe two new transcriptional start sites in ACVRL1 gene, and indicate that Sp1 is a key regulator of ACVRL1 transcription, providing new insights into the molecular mechanisms that contribute to the expression of ACVRL1 gene. Moreover, our data show that the methylation status of CpG islands markedly modulates the Sp1 regulation of ACVRL1 gene transcriptional activity.


Figures

Figure 1
Figure 1
5' Rapid Amplification of cDNA Ends (5'RACE) of ACVRL1 transcripts from HUVECs. Electrophoretic analysis of nested PCR amplification products. Lanes: 1 and 2 (without template; outer and inner nested PCRs), 3 and 4 (RNA without CIP/TAP treatment; outer and inner), 5 and 6 (CIP/TAP treated RNA; outer and inner). More than 10 different experiments were performed and three representative gels are shown. (B) Nucleotide sequence of the products. Primers used are underlined. Grey boxes indicate the junctions between different exons. The predominant transcript found in HUVECs corresponds to the mRNA1 previously described in placenta. Two novel variants described in this work have been named mRNA3 [GenBank:HM161905] and mRNA4 [GenBank:HM161906]. Numbers are given according to the genomic sequence from + 1 TSS. Fragments starting from -510 of mRNA3 and from -470 of mRNA4 are the newly observed transcribed regions. The sequences of these three isoforms are identical downstream from + 79. (C) Schematic representation of the 5' flanking region of ACVRL1 transcripts. The previously described mRNA1 [GenBank:NM 000020.2] and mRNA2 [GenBank:NM 001077401.1], and mRNA3 and mRNA4 found in this work are shown. All ACVRL1 encoded proteins found to date have the same 503 amino acid sequence. mRNA1 has been found with the same characteristics as previously described. Taking into account the new sequence, ACVRL1 rearranges from 10 to 11 exons; starting the new exon 1 at -510 (variant 1A) or -470 (variant 1B). Also, previously described exon 1 is renamed as exon 2 (variants 2A and 2B). Red arrows represent the two newly described TSSs. Blue arrows represent the two TSSs previously known.
Figure 2
Figure 2
Nucleotide sequence of the 5'-flanking region of the ACVRL1 gene and in silico analysis of the putative transcription factor binding sites. Red arrows show the newly described TSSs (-510 and -470). The blue arrow indicates the already described TSS (+ 1). The sequence lacks TATA and CAAT boxes. Putative transcription factor binding motifs for AP1 (Activator protein 1), AP4 (Activator protein 4), CEBP (CCAAT/Enhancer Binding protein), E2F (Elongation Factor 2), EKLF/KLF1 (Krüppel-Like Factor 1), ETS (E26-Transformation Specific transcription factor), GKLF/KLF4 (Krüppel-Like Factor 4), HIF (Hypoxia Inducible Factor), NFκB (Nuclear Factor of kappa light polypeptide gene enhancer in B-cells), RXR (Retinoid X Receptor), Smad (Sma and Mad-related factor), Sp1 and ZF9/KLF6 (Krüppel-Like Factor 6) are indicated by boxes. The core consensus sequences for each factor are in bold. A large number of Sp1 consensus binding sites are present in the sequence. Data were generated using the Genomatix MatInspector software tool.
Figure 3
Figure 3
Sequence alignment of the human ACVRL1 TSSs across different mammalian species. (A) Scheme of the human sequences used for the alignment. The blue arrow indicates the previously described TSS (+ 1). The red arrows indicate the new TSSs identified in Figure 1. (B) Sequences from chimpanzee, orangutan, rhesus monkey, cow, dog, horse, mouse and rat were compared with the human -1,035/+210 sequence. Sequences were obtained from NCBI-GenBank and EMBL databases (see Methods). Asterisks indicate the totally conserved residues across species. Alignments of the putative regulatory sites are shown with a colored background based on the identity between species. The degree of homology is: black > dark grey > light grey. Score means percentage of identity with the human sequence. Brackets indicate exonic sequences.
Figure 4
Figure 4
Sp1 consensus binding sites located along the human ACVRL1 promoter and alignment with other mammalian species. (A) Schematic representation of the 14 Sp1 consensus sites found in silico along the -1,035/+210 fragment of ACVRL1 promoter sequence. Red arrows show the newly described TSSs. The blue arrow indicates the already described TSS (+ 1). (B) Alignment with other mammalian species (source of sequences as in Figure 3). Numbers are referred to the human sequence and range from -1,035 to + 210 bp. Asterisks indicate the totally conserved residues across species. Alignments of the putative regulatory sites are shown in grey background. All the human nucleotides selected for the alignment (grey background) have a Ci-value > 60. Ci = Consensus index value. It represents the degree of conservation of each position within the matrix. Putative core sequences for the binding of Sp1 are underlined. The core sequence (usually 4 residues) of a matrix is defined as the most conserved with the theoretical consensus. Additional information about each site can be found in Table 1.
Figure 5
Figure 5
Transcriptional activity of the human ACVRL1 promoter. (A) Schematic representation of the ACVRL1 promoter fragment cloned into the promoterless pGL2-luc reporter vector with the three TSS. (B) Left, 5'-deleted construct series of the whole sequence obtained by PCR and cloned into pGL2-luc. The size of each construct compared with the size of the whole promoter construct is shown in the scheme. Right, transient transfection of ACVRL1 promoter 5'-deleted constructs in the human endothelial cell line HMEC-1. Transfection efficiency was corrected by relating luciferase activity to β-galactosidase activity. Results are expressed as a percentage of activity respect to the activity of the full length construct (-1,035/+210; 100%) (*p < 0.05, **p < 0.01 versus -1,035/+210 pALK1 construct). (C) Effect of ALK1 ligands TGF-β1 and BMP9 on ACVRL1 promoter activity. HMEC-1 cells were transiently transfected with ACVRL1 5'-deleted mutants, and pretreated with 1 ng/ml TGF-β1 for 3 hours or 0.5 ng/ml BMP9 for 15 hours. Results are shown in fold induction values respect to basal activity. No significant effect on ACVRL1 promoter activity was observed, except a little increase with BMP9 on the -422/+59 construct (*p < 0.05; **p < 0.01; ns = not significant).
Figure 6
Figure 6
Effect of Sp1 expression on ACVRL1 promoter activity. (A) Dose-response effect of Sp1 on the transcriptional activity of ACVRL1 promoter in Schneider S2 and HEK293T cells. S2 (Sp1-less) and HEK293T cells were cotransfected with the pGL2 empty vector or the ACVRL1 promoter construct -1,035/+210 and with increasing amounts of the Sp1 expression vector (pPac-Sp1 and pCIneo-Sp1, respectively). Luciferase activity was corrected with β-galactosidase activity and expressed as fold induction of the transcriptional activity of pALK1 in the absence of exogenous Sp1. (B) Left, scheme showing the distribution of the different Sp1 consensus binding sites along the ACVRL1 promoter (black ovals) in the different constructs. Right, transient transfection of Schneider S2 cells with 25 ng of pPac-Sp1 and the indicated ACVRL1 promoter constructs. Fold-induction values respect to basal activity are indicated on top of each bar. (C) Effect of Sp1-knock down on ACVRL1 transcriptional activity. HEK293T cells were transfected with Sp1 siRNA. Left, Sp1 mRNA and protein levels were measured by semiquantitative RT-PCR and western blot after 48 hr. Right, 24 hr after the siRNA Sp1 transfection, the different ACVRL1 promoter constructs were transfected. The transcriptional activity of all the fragments was measured and normalized by the β-galactosidase activity. Basal pALK1 activity (100%) and the reduction after Sp1 silencing (grey bars) are shown. In every case, Sp1 suppression resulted at least in a decrease of 50% in ACVRL1 transcriptional activity (***p < 0.005).
Figure 7
Figure 7
Sp1 interacts with ACVRL1 promoter in HUVECs. (A) Scheme showing the primers used for Chromatin immunoprecipitation (ChIP). The whole sequence of ACVRL1 promoter is mapped along four regions of approximately 200-250 bp. (B) Sp1 ChIP on ACVRL1 promoter in HUVECs. The chromatin was digested obtaining a 150-300 bp fragments-enrichment. Anti-Histone 3 and a pool of rabbit-IgGs were used as positive and negative controls. Input DNA was loaded before (Inp) and after (PInp) a preclearing process. (C) As a negative control of a gene promoter that does not ChIP with Sp1, a fragment of erythropoietin (EPO) promoter was used [36]. (D) Sp1 binding to the different pALK1 regions from the ChIP experiment in B was measured by densitometry of the individual bands and values of the (Sp1-IgG)/PInput ratios were represented. (E) Scheme of the ACVRL1 promoter fragment used as probe for EMSA assays and competitor mutant probes generated. (F) Electrophoretic Mobility Shift Assays (EMSA) shows the binding of Sp1 to the -89/-56 bp region of ACVRL1 promoter. Two Sp1 sites and one KLF6 site are framed in this region. EMSAs were performed with 32P-labelled WT probe. Cold probes were: WT; Mut A, mutated at the -84/-78 site; Mut B, mutated at the -67/-62 site; and two irrelevant sequences, the -823/-795 region of ACVRL1 promoter (-823) and AATT. A positive control of Sp1 was included in lane 8 using a probe from ENG promoter as described in Methods. The retarded Sp1 band is indicated by the arrow. The asterisks indicate the supershifted band obtained by addition of the anti-Sp1 antibody. The insert on the right, includes an over-exposition of the supershift corresponding to lanes 14 and 15. As negative controls, anti-Sp3 and anti-NFκB antibodies were included.
Figure 8
Figure 8
Two CpG islands are present in the ACVRL1 promoter and treatment with the demethylating agent 5'-aza-2'-deoxycytidine increases ALK1 expression in endothelial cells. (A) Schematic representation of the ACVRL1 promoter comprising the region -1,035 to + 210 bp. CG sites are depicted by black bars. Two CpG islands near the transcriptional start site were detected using CpGplot software tool. CG content is shown as percentage the total number of G+C (top), and by the methylation-susceptible CG pairs, represented by the observed-versus-expected index (bottom). (B, C) ALK1 and Id1 transcript levels from endothelial (HUVEC, HMEC-1) versus non endothelial (HEK293T) cells prior and after treatment with the demethylating agent 5-aza-dC. Id1 mRNA levels were measured as a target gene of ALK1 signalling. (B) Cells were treated with 1 μM or 5 μM 5-aza-dC for one week. Treatment with 5 μM was cytotoxic in HUVEC. RNA was extracted and mRNA levels were measured by real time RT-PCR. Results are shown as the fold change respect to basal expression (2 -ΔΔCt). (C) Basal ALK1 and Id1 levels show the differences between ALK1 expression in endothelial cells HMEC-1 and HUVEC versus the HEK293T cells. (D) Effect of the demethylating agent 5-aza-dC on the ALK1 pathway specific reporter, p(BRE) 2-luc, in HMEC-1 cells. Results are shown as fold change of expression levels or luciferase activity (***p < 0.005).
Figure 9
Figure 9
Effect of in vitro methylation on the ACVRL1 promoter activity. (A, B) Different reporter constructs were subjected to treatment with M.SssI in the presence or absence of the substrate S-adenosyl-methyonine. Both mock-methylated and methylated constructs were transfected in HEK293T and HMEC-1 cells and the luciferase activity was measured. (***p < 0.005; ns = not significant). (A) Analysis of the different pALK1 reporter constructs. Results are shown as fold changes of luciferase activity (B) Analysis of a TATAbox minimal promoter (see Methods), the Id1 promoter construct and the -1035/+210 pALK1 reporter construct. Activities of untreated samples were given the arbitrary value of 100% and the activity of treated samples is indicated as percentage. (C) Electrophoretic mobility shift assay (EMSA) of the radiolabelled -89/-56 probe containing two Sp1 functional sites. Competition was carried out using the unmethylated (U) or the in vitro methylated (M) probe, as indicated.

Similar articles

Cited by

References

    1. Johnson DW, Berg JN, Baldwin MA, Gallione CJ, Marondel I, Yoon SJ, Stenzel TT, Speer M, Pericak-Vance MA, Diamond A. Mutations in the activin receptor-like kinase 1 gene in hereditary haemorrhagic telangiectasia type 2. Nat Genet. 1996;13:189–195. doi: 10.1038/ng0696-189. - DOI - PubMed
    1. Su AI, Wiltshire T, Batalov S, Lapp H, Ching KA, Block D, Zhang J, Soden R, Hayakawa M, Kreiman G. A gene atlas of the mouse and human protein-encoding transcriptomes. Proc Natl Acad Sci USA. 2004;101:6062–6067. doi: 10.1073/pnas.0400782101. - DOI - PMC - PubMed
    1. Roelen BA, van Rooijen MA, Mummery CL. Expression of ALK-1, a type 1 serine/threonine kinase receptor, coincides with sites of vasculogenesis and angiogenesis in early mouse development. Dev Dyn. 1997;209:418–430. doi: 10.1002/(SICI)1097-0177(199708)209:4<418::AID-AJA9>3.0.CO;2-L. - DOI - PubMed
    1. Sanz-Rodriguez F, Fernandez LA, Zarrabeitia R, Perez-Molino A, Ramirez JR, Coto E, Bernabeu C, Botella LM. Mutation analysis in Spanish patients with hereditary hemorrhagic telangiectasia: deficient endoglin up-regulation in activated monocytes. Clin Chem. 2004;50:2003–2011. doi: 10.1373/clinchem.2004.035287. - DOI - PubMed
    1. Konig HG, Kogel D, Rami A, Prehn JH. TGF-β1 activates two distinct type I receptors in neurons: implications for neuronal NF-κB signaling. J Cell Biol. 2005;168:1077–1086. doi: 10.1083/jcb.200407027. - DOI - PMC - PubMed

Publication types

MeSH terms