

A modified version of Moran's I
- PMID: 20587045
- PMCID: PMC2903534
- DOI: 10.1186/1476-072X-9-33
A modified version of Moran's I
Abstract
Background: Investigation of global clustering patterns across regions is very important in spatial data analysis. Moran's I is a widely used spatial statistic for detecting global spatial patterns such as an east-west trend or an unusually large cluster. Here, we intend to improve Moran's I for evaluating global clustering patterns by including the weight function in the variance, introducing a population density (PD) weight function in the statistics, and conducting Monte Carlo simulation for testing. We compare our modified Moran's I with Oden's I*pop for simulated data with homogeneous populations. The proposed method is applied to a census tract data set.
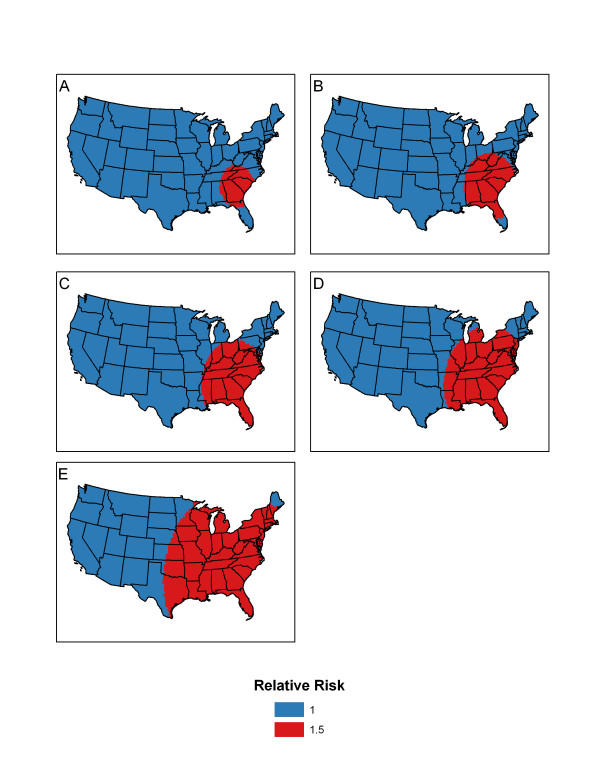
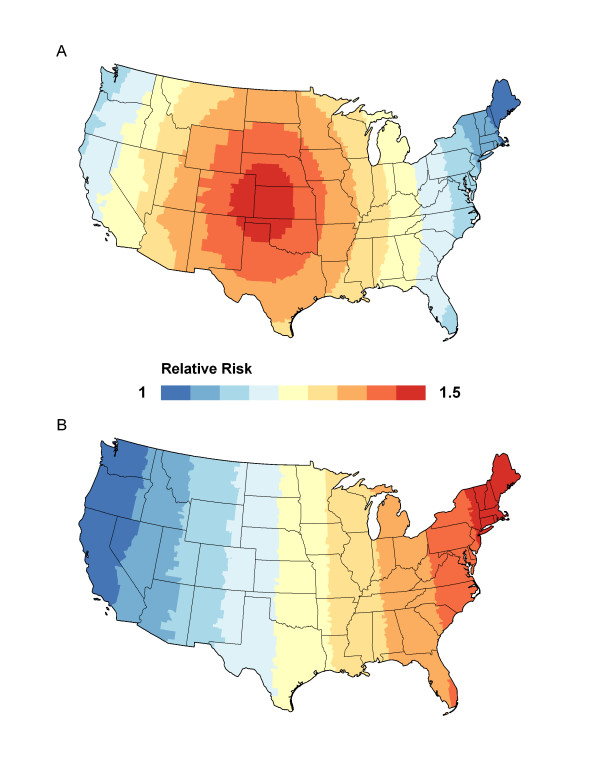
Methods: We present a modified version of Moran's I which includes information about the strength of the neighboring association when estimating the variance for the statistic. We provide a power analysis on Moran's I, a modified version of Moran's I, and I*pop in a simulation study. Data were simulated under two common spatial correlation scenarios of local and global clustering.
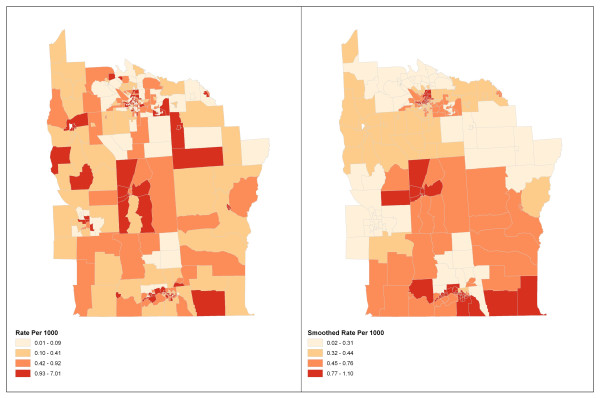
Results: For simulated data with a large cluster pattern, the modified Moran's I has the highest power (43.4%) compared to Moran's I (39.9%) and I*pop (12.4%) when the adjacent weight function is used with 5%, 10%, 15%, 20%, or 30% of the total population as the geographic range for the cluster.For two global clustering patterns, the modified Moran's I (power > 25.3%) performed better than both Moran's I (> 24.6%) and I*pop (> 7.9%) with the adjacent weight function. With the population density weight function, all methods performed equally well.In the real data example, all statistics indicate the existence of a global clustering pattern in a leukemia data set. The modified Moran's I has the lowest p-value (.0014) followed by Moran's I (.0156) and I*pop (.011).
Conclusions: Our power analysis and simulation study show that the modified Moran's I achieved higher power than Moran's I and I*pop for evaluating global and local clustering patterns on geographic data with homogeneous populations. The inclusion of the PD weight function which in turn redefines the neighbors seems to have a large impact on the power of detecting global clustering patterns. Our methods to improve the original version of Moran's I for homogeneous populations can also be extended to some alternative versions of Moran's I methods developed for heterogeneous populations.
Figures
References
-
- Rogerson P. The detection of clusters using a spatial version of the Chi-Square Goodness-of-Fit Statistic. Geographical Analysis. 1999;31(1):128–147.
-
- Walter SD. The analysis of regional patterns in health data. II. The power to detect environmental effects. Am J Epidemiol. 1992;136(6):742–759. - PubMed
-
- Waller LA, Gotway CA. Applied Statistics for Public Health Data. New York: Wiley; 2004.
-
- Jackson MC, Waller LA. Exploring Goodness-of-fit and spatial correlation using components of Tango's Index of spatial clustering. Geographical Analysis. 2005;37(4):371–382. doi: 10.1111/j.0016-7363.2005.03704004.x. - DOI
-
- Moran PAP. Notes on continuous stochastic phenomena. Biometrika. 1950;37:17–23. - PubMed
