. 2010 Sep 10;285(37):28553-64.
doi: 10.1074/jbc.M110.149393. Epub 2010 Jun 29.

p300-mediated acetylation of histone H3 lysine 56 functions in DNA damage response in mammals

Affiliations

p300-mediated acetylation of histone H3 lysine 56 functions in DNA damage response in mammals

Rahul K Vempati et al. J Biol Chem. .

Abstract

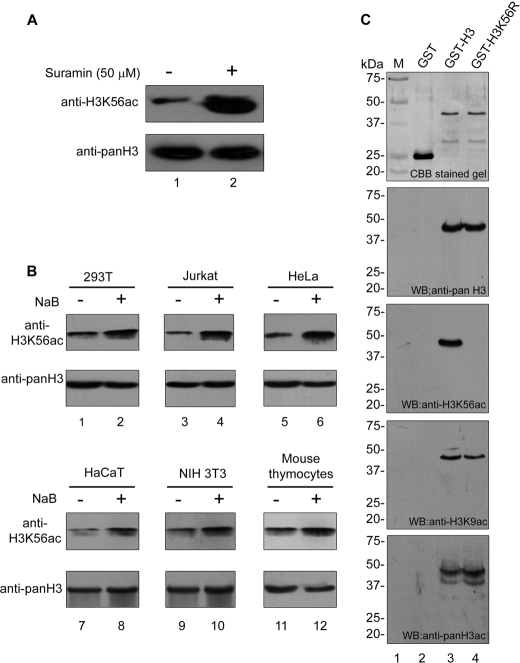
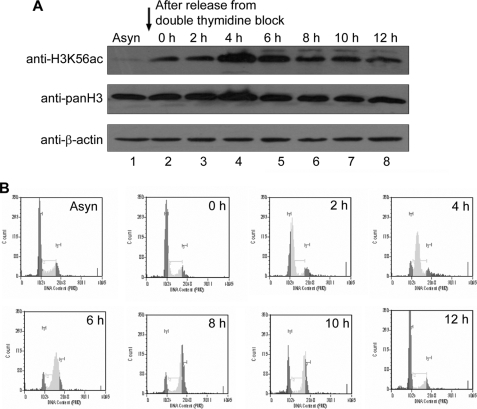
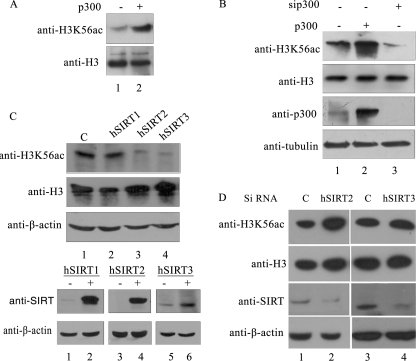
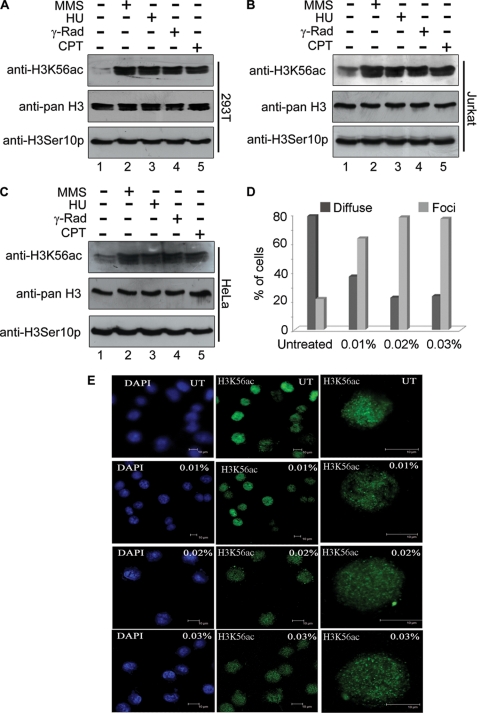
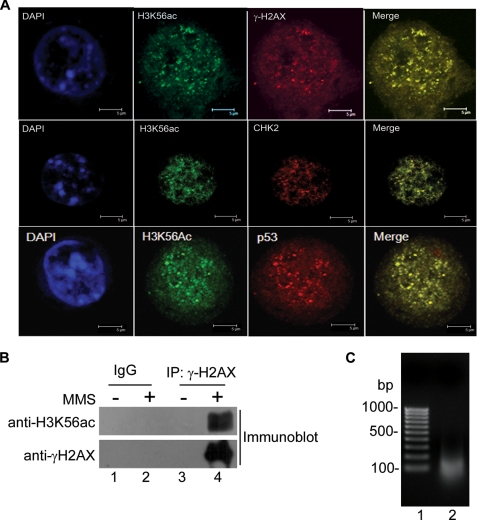
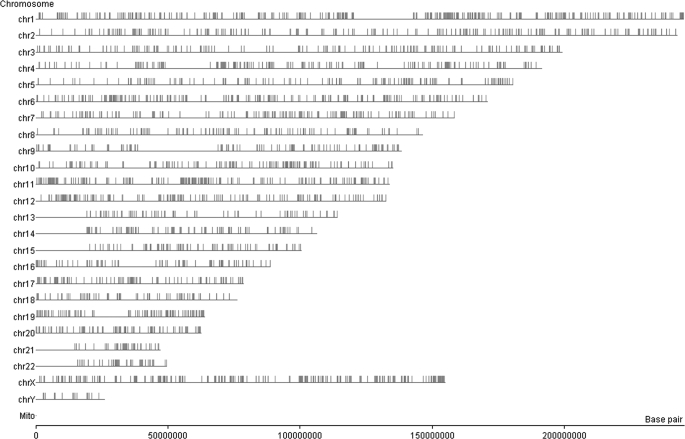
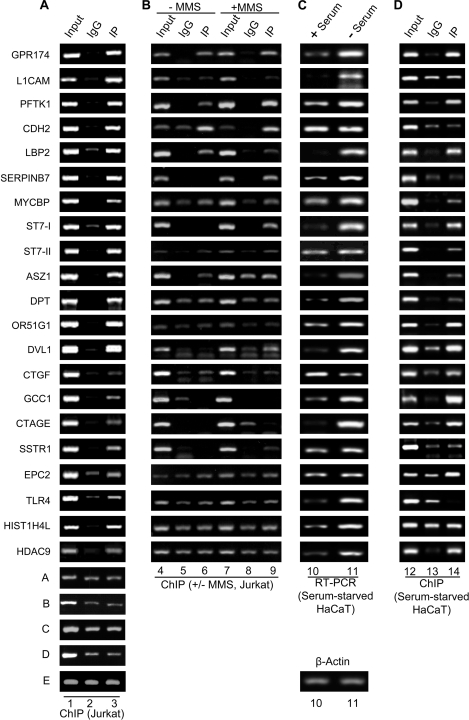
The packaging of newly replicated and repaired DNA into chromatin is crucial for the maintenance of genomic integrity. Acetylation of histone H3 core domain lysine 56 (H3K56ac) has been shown to play a crucial role in compaction of DNA into chromatin following replication and repair in Saccharomyces cerevisiae. However, the occurrence and function of such acetylation has not been reported in mammals. Here we show that H3K56 is acetylated and that this modification is regulated in a cell cycle-dependent manner in mammalian cells. We also demonstrate that the histone acetyltransferase p300 acetylates H3K56 in vitro and in vivo, whereas hSIRT2 and hSIRT3 deacetylate H3K56ac in vivo. Further we show that following DNA damage H3K56 acetylation levels increased, and acetylated H3K56, which is localized at the sites of DNA repair. It also colocalized with other proteins involved in DNA damage signaling pathways such as phospho-ATM, CHK2, and p53. Interestingly, analysis of occurrence of H3K56 acetylation using ChIP-on-chip revealed its genome-wide spread, affecting genes involved in several pathways that are implicated in tumorigenesis such as cell cycle, DNA damage response, DNA repair, and apoptosis.


Figures

FIGURE 1.
FIGURE 1.
Histone H3 is acetylated at lysine 56 in mammals. A, H3K56ac levels in HEK 293T cells in the absence (−) and presence (+) of NAD-dependent HDAC inhibitor suramin. HEK 293T cells were treated with suramin (50 μm, lane 2) for 24 h, and histones were enriched by acid extraction of nuclear proteins as described under “Experimental Procedures.” Cells without any treatment (lane 1) were taken as controls. Eight μg of acid extracted proteins were immunoblotted using anti-H3K56ac antibodies (upper panel). Total H3 detected by anti-pan H3 antibody was used as a loading control (lower panel). B, H3K56 acetylation increases in the presence of sodium butyrate. H3K56 acetylation levels in HEK 293T (lanes 1 and 2), Jurkat (lanes 3 and 4), HeLa (lanes 5 and 6), HaCaT (lanes 7 and 8), NIH 3T3 (lanes 9 and 10), and mouse thymocytes (lanes 11 and 12) in the absence (lanes 1, 3, 5, 7, 9, and 11) and presence (lanes 2, 4, 6, 8, 10, and 12) of 10 mm sodium butyrate (NaB) were monitored by immunoblotting. The cells were treated with 10 mm sodium butyrate for 24 h, and the histones were enriched by acid extraction of nuclear proteins as described under “Experimental Procedures.” 0.5 μg of acid extracted proteins were resolved by SDS-PAGE and immunoblotted using anti-H3K56ac (upper panels). Immunoblot using anti-pan H3 served as a loading control; however, to avoid signal saturation only 0.1 μg of acid extracted protein was used (lower panels). C, the specificity of anti-H3K56 ac antibody was determined by in vitro acetylation and immunoblotting. 250 ng each of GST (lane 2), GST-wtH3 (lane 3), and GST-mutH3K56R (lane 4) were resolved on a 10% SDS-PAGE gel (Fig. 1A; top panel). In vitro acetylation was performed with p300 as described under “Experimental Procedures,” and 50 ng of each sample was resolved on a 10% SDS-polyacrylamide gel. Immunoblotting was performed with anti-pan H3 (second panel), anti-H3K56ac (third panel), anti-H3K9ac (fourth panel), and anti-pan H3ac (fifth panel) antibodies. Molecular weight standards (lane 1) and the corresponding masses (in kDa) are indicated on the left for each panel. WB, Western blot.
FIGURE 2.
FIGURE 2.
H3K56 acetylation levels oscillate during cell cycle. A, HeLa cells were synchronized by double thymidine block and released to progress through the cell cycle as described under “Experimental Procedures.” The cells were collected before (Asyn) and after thymidine treatment (0 h) and every 2 h after release (up to 12 h); cell lysates were prepared; and H3K56 acetylation was analyzed by immunoblot. Immunoblotting with anti-pan H3 and anti-β-actin was used as a loading control. B, cell cycle progression was analyzed by monitoring DNA content by flow cytometry as described under “Experimental Procedures.” The dark gray, very light gray, and light gray peaks correspond to cells in the G1, S, and G2/M phases of the cell cycle, respectively.
FIGURE 3.
FIGURE 3.
Enzymes involved in the acetylation and deacetylation of H3K56 in human system. A, p300-mediated in vitro acetylation of histones extracted from HEK 293T cells. In vitro acetylation reaction was performed in the presence (lane 1) or absence (lane 2) of recombinant p300 as described under “Experimental Procedures.” The upper panel depicts immunoblot analysis using anti-H3K56ac antibodies, whereas the level of total H3 is shown in the lower panel. B, p300 acetylates H3K56 in vivo. p300 was overexpressed (lane 2) and silenced (lane 3) separately in HEK 293T cells as described under “Experimental Procedures.” The histones were isolated and immunoblotted for monitoring H3K56ac and H3 levels (upper two panels). Expression of p300 and tubulin was monitored by immunoblot analysis of the same samples. C and D, hSIRT2 and hSIRT3 deacetylate H3K56 in vivo. Sirtuins involved in the deacetylation of H3K56ac were tested by monitoring the reduction in the level of H3K56 acetylation upon overexpression of hSIRT1, hSIRT2, and hSIRT3 (C) and siRNA-mediated knockdown of hSIRT2 and hSIRT3 (D) by transient transfection in HEK 293T cells as described under “Experimental Procedures.” Immunoblotting anti-H3 and anti-β-actin was used as a loading control. Expression of the three sirtuins was confirmed using immunoblotting of lysates from control (−) and transfected (+) cells using anti-SIRT antibody (upper panel). Immunoblot with anti-β-actin (lower panel) was used as a loading control.
FIGURE 4.
FIGURE 4.
DNA damage-induced hyperacetylation and relocalization of histone H3 lysine 56 to subnuclear foci. A–C, H3K56ac levels increased in HEK 293T cells (A), Jurkat cells (B), and HeLa cells (C) on treatment with various DNA-damaging agents, viz. MMS (0.015%, lanes 2), hydroxyurea (10 μm, lanes 3), γ-irradiation (5 grays, lanes 4), and campetothecin (2 μm, lanes 5). (−) and (+) indicate the absence and presence, respectively, of the DNA-damaging agents. The cells were treated with various DNA-damaging agents as described under “Experimental Procedures,” and histones were then prepared by acid extraction. Immunoblot analysis was performed using anti-H3K56ac (top panel), anti-pan H3 (middle panel), and anti-H3S10p (bottom panel). D and E, DNA damage-dependent relocalization of H3K56 acetylation to discrete nuclear foci. HEK 293T cells were treated with different concentrations of MMS as indicated on the top right corner of each panel on the left (E). The cells were then immunostained as described under “Experimental Procedures.” The first two columns of panels in E show fields of multiple cells immunostained with anti-H3K56ac, and DNA was counterstained with DAPI. The last column of panels shows higher magnification images of single cells immunostained with anti-H3K56ac antibody. D, the percentages of cells showing diffused staining and discrete foci are shown; in all samples, 250 cells were counted and plotted in a bar graph.
FIGURE 5.
FIGURE 5.
Localization of acetylated H3K56 at the sites of DNA repair. A, HEK 293T cells were treated with 0.02% MMS and coimmunostained with anti-H3K56ac antibody and anti-γ-H2AX antibody (top panels), anti-Chk2 antibody (middle panels), and anti-p53 antibody (bottom panels). The nuclei were stained with DAPI. B, coimmunoprecipitation of H3K56ac and γ-H2AX on DNA damage. HEK 293T cells were treated with 0.02% MMS, and the cell lysates were prepared as described under “Experimental Procedures.” Coimmunoprecipitation was carried out with anti-γ-H2AX antibody. The immunoprecipitated samples were run on 15% SDS-PAGE and immunoblotted using anti-H3K56ac antibodies and anti-γ-H2AX antibodies as indicated. C, size of DNA in the lysates used for IP. Agarose gel (1%) showing the size of DNA fragment in the input for IP (lane 2). DNA was isolated from lysates prepared for IP as described under “Experimental Procedures” and run on a 1% agarose gel.
FIGURE 6.
FIGURE 6.
Genome-wide distribution of H3K56 acetylation. Map depicting genome-wide occupancy of H3K56 acetylation. ChIP-on-chip was performed using anti-H3K56ac antibody as described under “Experimental Procedures,” and analysis of enriched genomic regions was carried out using Genespring GX10 software (Agilent Technologies). Each vertical line on the chromosomal map represents the location of an enriched probe. Certain regions on various chromosomes show clustering of H3K56ac occupancy.
FIGURE 7.
FIGURE 7.
H3K56ac is enriched in upstream regulatory regions of multiple genes involved in the cellular pathways implicated in DNA damage response and tumorigenesis in Jurkat cells and G1 arrested HaCaT cells. A, ChIP analysis was performed in Jurkat cells treated with 10 mm sodium butyrate for 24 h using anti-H3K56ac antibody, as described under “Experimental Procedures.” The gel pictures in individual panels depict PCR-amplified products using primers specific for the indicated genes and the DNA eluted from chromatin, immunoprecipitated using anti-H3K56ac (lane 3) and control rabbit IgG (lane 2). Lane 1, input chromatin. The last five panels (rows A–E) depict the controls from genomic loci that show no specific enrichment in the immunoprecipitated chromatin over the control IgG. B, ChIP analysis was performed in control (− MMS, lanes 4–6) Jurkat cells and Jurkat cells treated with 0.02% MMS for 2 h (+ MMS, lanes 7–9) as described under “Experimental Procedures.” The gel pictures in individual panels depict the PCR-amplified products using primers specific for the indicated genes and the DNA eluted from chromatin, immunoprecipitated using anti-H3K56ac (lanes 6 and 9) and control rabbit IgG (lanes 5 and 8). Lanes 4 and 7 depict input chromatin. C, real time quantitative RT-PCR was performed for monitoring the expression levels of the corresponding genes from A and B using cDNA obtained from control (+ serum, lane 10) and G1-arrested, serum-starved (− Serum, lane 11) HaCaT cells. The CT values for various genes were normalized with that of β-actin (bottom panel). D, ChIP was performed using anti-H3K56ac antibody in serum-starved HaCaT cells treated with 10 mm sodium butyrate for 24 h. The gel pictures in the individual panels depict PCR-amplified products using primers specific for the indicated genes and the DNA eluted from chromatin, immunoprecipitated using anti-H3K56ac (lane 14) and control rabbit IgG (lane 13). Lane 12, input chromatin. Quantitative ChIP-PCRs were performed, and the fold enrichment over IgG was calculated as described under “Experimental Procedures.” The quantification of all of the above PCRs is tabulated in supplemental Table S2.

Similar articles

Cited by

References

    1. Ehrenhofer-Murray A. E. (2004) Eur. J. Biochem. 271, 2335–2349 - PubMed
    1. Luger K., Mäder A. W., Richmond R. K., Sargent D. F., Richmond T. J. (1997) Nature 389, 251–260 - PubMed
    1. Peterson C. L., Laniel M. A. (2004). Curr. Biol. 14, R546–R551 - PubMed
    1. Bird A. W., Yu D. Y., Pray-Grant M. G., Qiu Q., Harmon K. E., Megee P. C., Grant P. A., Smith M. M., Christman M. F. (2002) Nature 419, 411–415 - PubMed
    1. Kouzarides T. (2007) Cell 128, 693–705 - PubMed

Publication types

MeSH terms