. 2010 Jul 15;70(14):5840-50.
doi: 10.1158/0008-5472.CAN-10-0847. Epub 2010 Jun 29.

DNMT3B7, a truncated DNMT3B isoform expressed in human tumors, disrupts embryonic development and accelerates lymphomagenesis

Affiliations

DNMT3B7, a truncated DNMT3B isoform expressed in human tumors, disrupts embryonic development and accelerates lymphomagenesis

Mrinal Y Shah et al. Cancer Res. .

Abstract

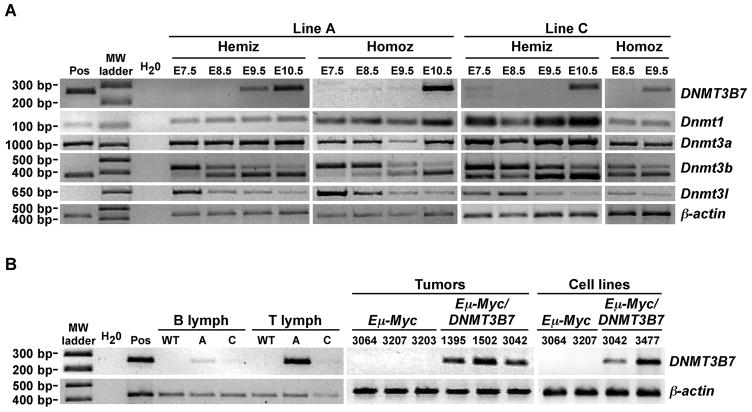
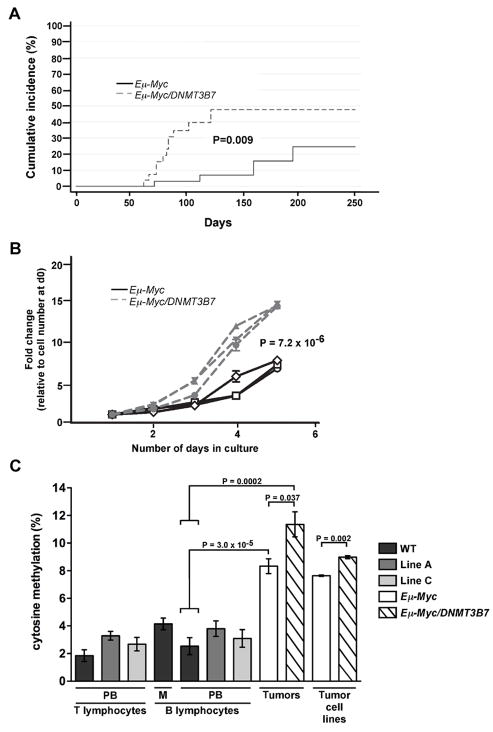
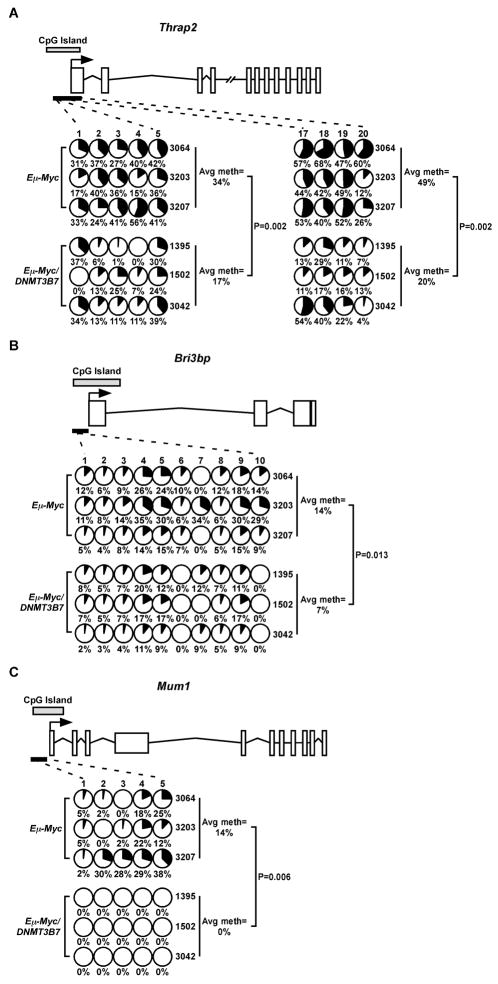
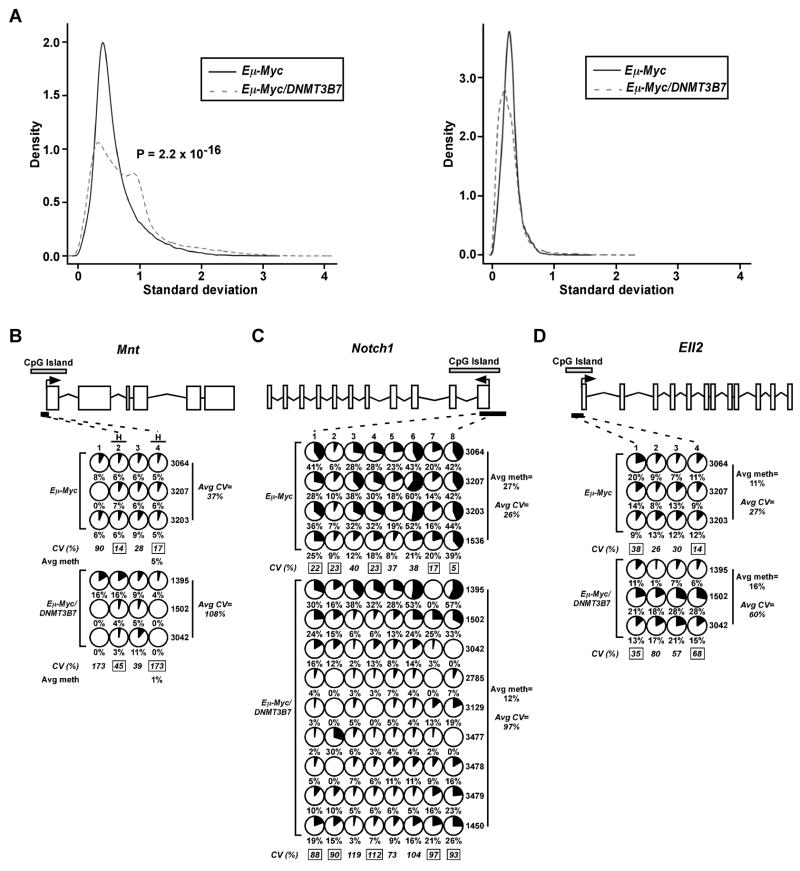
Epigenetic changes are among the most common alterations observed in cancer cells, yet the mechanism by which cancer cells acquire and maintain abnormal DNA methylation patterns is not understood. Cancer cells have an altered distribution of DNA methylation and express aberrant DNA methyltransferase 3B transcripts, which encode truncated proteins, some of which lack the COOH-terminal catalytic domain. To test if a truncated DNMT3B isoform disrupts DNA methylation in vivo, we constructed two lines of transgenic mice expressing DNMT3B7, a truncated DNMT3B isoform commonly found in cancer cells. DNMT3B7 transgenic mice exhibit altered embryonic development, including lymphopenia, craniofacial abnormalities, and cardiac defects, similar to Dnmt3b-deficient animals, but rarely develop cancer. However, when DNMT3B7 transgenic mice are bred with Emicro-Myc transgenic mice, which model aggressive B-cell lymphoma, DNMT3B7 expression increases the frequency of mediastinal lymphomas in Emicro-Myc animals. Emicro-Myc/DNMT3B7 mediastinal lymphomas have more chromosomal rearrangements, increased global DNA methylation levels, and more locus-specific perturbations in DNA methylation patterns compared with Emicro-Myc lymphomas. These data represent the first in vivo modeling of cancer-associated DNA methylation changes and suggest that truncated DNMT3B isoforms contribute to the redistribution of DNA methylation characterizing virtually every human tumor.


Figures

Figure 1
Figure 1
Phenotypic abnormalities of DNMT3B7 transgenic mice. A, Top, Schematic diagram of DNMT3B, and the DNMT3B7 isoform. Numbers indicate positions of amino acids (aa). N, N-terminus; C, C-terminus; NLS, nuclear localization signal; PWWP domain, conserved proline-tryptophan-tryptophan-proline motif; PHD domain, plant homeodomain. The asterisks represent the five novel amino acids present in DNMT3B7. Bottom, Schematic diagram of the DNMT3B7 transgenic construct. B, Coronal sections of E15.5 wild-type and DNMT3B7 transgenic mice. Red arrowheads indicate the right eye, and green arrowheads indicate the left eye. Black arrowheads indicate the location of the hard palate. C, Hemotoxylin and eosin-stained sections of the ventricles from E14.5 wild-type and DNMT3B7 animals. A black arrowhead indicates the location of a sub-aortic ventricular septal defect in a homozygous transgenic animal, and yellow arrows indicate the presence of a thin myocardium. RV, right ventricle; LV, left ventricle. D, FACS analysis of B lymphocytes and serum immunoglobulin analysis from Line A transgenic animals. The percentage of total B lymphocytes (top) and of mature IgM+B220+ B lymphocytes (middle) present in the peripheral blood of Line A homozygous versus wild-type animals at P0. Quantitation of IgA levels measured from serum of Line A homozygous versus wild-type animals (bottom). *** denotes P≤0.0003, ** denotes P≤0.009, and * denotes P≤0.01 between wild-type and homozygous animals using the two-tailed Student’s t-test. Values represent mean ± s.e.m.
Figure 2
Figure 2
DNMT3B7 expression in Line A and Line C by RT-PCR. A, RT-PCR amplification in DNMT3B7 transgenic embryos from E7.5–E10.5. The positive control (Pos) is from a Line A hemizygous embryo at E15.5. Molecular weight markers are indicated to the left. Hemiz, hemizygous; Homoz, homozygous. The identities of each amplicon are given to the right. Amplification of β-actin served as the loading control. B, RT-PCR amplification of DNMT3B7 in: B and T lymphocytes from DNMT3B7 transgenic adults at 10–20 weeks of age; Eμ-Myc/DNMT3B7 mediastinal tumors; and Eμ-Myc/DNMT3B7 mediastinal tumor cell lines. Lymph, lymphocytes; WT, wild-type; A, Line A; C, Line C. Mouse identification numbers are given along the top.
Figure 3
Figure 3
Kinetics and DNA methylation levels of mediastinal lymphomas from Eμ-Myc versus Eμ-Myc/DNMT3B7 transgenic mice. A, Cumulative incidence curves for the development of mediastinal lymphomas in Eμ-Myc (solid line) versus Eμ-Myc/DNMT3B7 mice (dashed line). Curves were compared using a K-sample test (Gray statistics=6.80, P=0.009). B, Growth curves of cell lines established from mediastinal lymphomas of Eμ-Myc versus Eμ-Myc/DNMT3B7 mice. Curves represent average growth obtained from triplicate cultures of three independently derived cell lines for each genotype. Curves were compared using the two-tailed Student’s t-test (P=7.2 × 10⁻⁶). C, Quantitation of total 5-methylcytosine levels in normal compared to malignant lymphocytes, n ≥ 3 for each genotype. PB, peripheral blood; M, mediastinal cells. Mouse genotypes are distinguished by color: black, wild-type; dark grey, DNMT3B7, Line A; light grey, DNMT3B7, Line C; white, Eμ-Myc; hatched, Eμ-Myc/DNMT3B7. Results shown are mean ± s.e.m. P values were calculated using the two-tailed Student’s t-test.
Figure 4
Figure 4
DNA methylation changes in specific genes from gene expression profiling of mediastinal lymphomas. Methylation changes were assessed by bisulfite sequencing in the CpG islands of A, Thrap2; B, Bri3bp; and C, Mum1. Schematic diagrams for each gene are shown (not to scale). Exons are represented by vertical rectangles, and the location of the CpG island is shown with a horizontal, shaded rectangle. The black arrow indicates the location of the transcriptional start site (TSS). The smaller, black horizontal rectangle indicates the location of the CpGs analyzed for changes in DNA methylation. Each row represents methylation data from a single lymphoma, indicated to the right. Numbers across the top indicate specific CpG dinucleotides in a region of the CpG island. Changes in methylation of specific CpG dinucleotides are indicated by small, shaded circles. Shading indicates the average amount of DNA methylation at each CpG, and the number below the circles represents percent methylated cytosine. Average percent methylation is indicated to the right, and P values were calculated using the two-tailed Student’s t-test.
Figure 5
Figure 5
Increased variability in DNA methylation of particular CpG dinucleotides within gene promoters is observed in mediastinal lymphomas of Eμ-Myc/DNMT3B7 mice. A, Left, Standard deviation of the signal density obtained from the HpaII channel of the HELP assay performed on Eμ-Myc lymphomas (solid line) and Eμ-Myc/DNMT3B7 lymphomas (dashed line). Right, Standard deviation of the signal density obtained from the MspI (control) channel of the HELP assay performed on Eμ-Myc lymphomas and Eμ-Myc/DNMT3B7 lymphomas. BD, Overall DNA hypo- or hypermethylation is mediated by individual CpG dinucleotides to varying degrees, as measured by bisulfite sequencing. Methylation changes in the CpG island of B, Mnt, C, Notch1, and D, Ell2. Schematic diagrams of each gene and the amount of methylation at CpG dinucleotides are as described in the legend of Figure 4. In panel B, CpG positions with an “H” over the number indicate the location of a HpaII site. Average percent methylation for each genotype is indicated to the right, except in panel B, where it is shown under the significant HpaII site. The average coefficient of variance (CV) is given as a percentage underneath each CpG position. CV values with a black box around the number denote P≤0.05 for Eμ-Myc versus Eμ-Myc/DNMT3B7 lymphomas at specific CpGs. The average CV across all positions for each genotype is indicated to the right.

References

    1. Jones PA, Baylin SB. The epigenomics of cancer. Cell. 2007;128:683–692. - PMC - PubMed
    1. Bernstein BE, Meissner A, Lander ES. The mammalian epigenome. Cell. 2007;128:669–681. - PubMed
    1. Irizarry RA, Ladd-Acosta C, Wen B, et al. The human colon cancer methylome shows similar hypo- and hypermethylation at conserved tissue-specific CpG island shores. Nat Genet. 2009;41:178–186. - PMC - PubMed
    1. Bestor TH. The DNA methyltransferases of mammals. Hum Mol Genet. 2000;9:2395–2402. - PubMed
    1. Li E. Chromatin modification and epigenetic reprogramming in mammalian development. Nat Rev Genet. 2002;3:662–673. - PubMed

Publication types

MeSH terms

Substances