

Long-term stability of demethylation after transient exposure to 5-aza-2'-deoxycytidine correlates with sustained RNA polymerase II occupancy
- PMID: 20587535
- PMCID: PMC3086892
- DOI: 10.1158/1541-7786.MCR-10-0189
Long-term stability of demethylation after transient exposure to 5-aza-2'-deoxycytidine correlates with sustained RNA polymerase II occupancy
Abstract
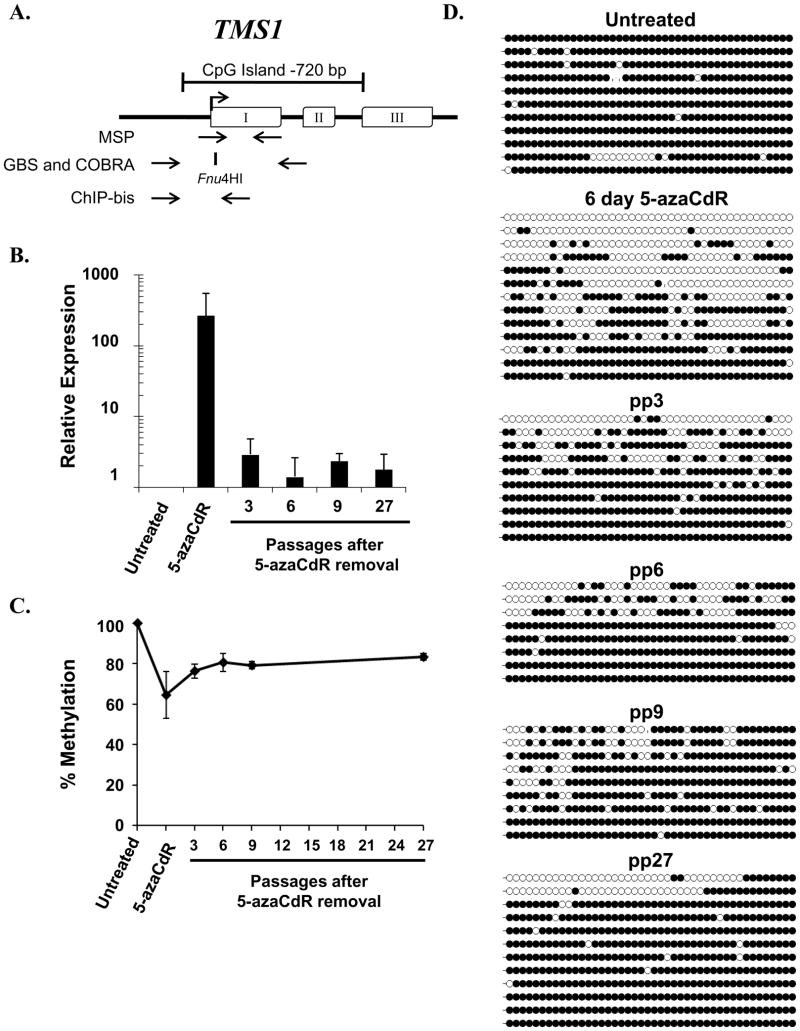
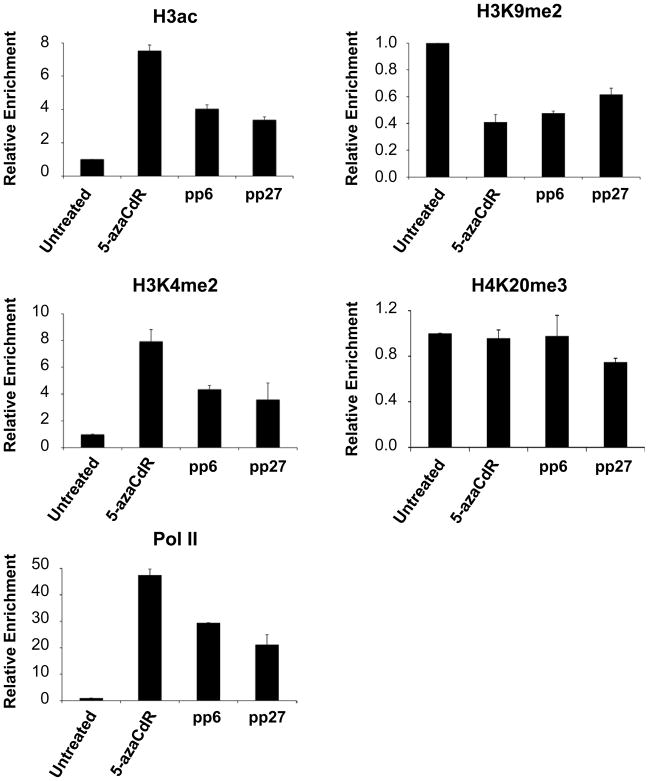
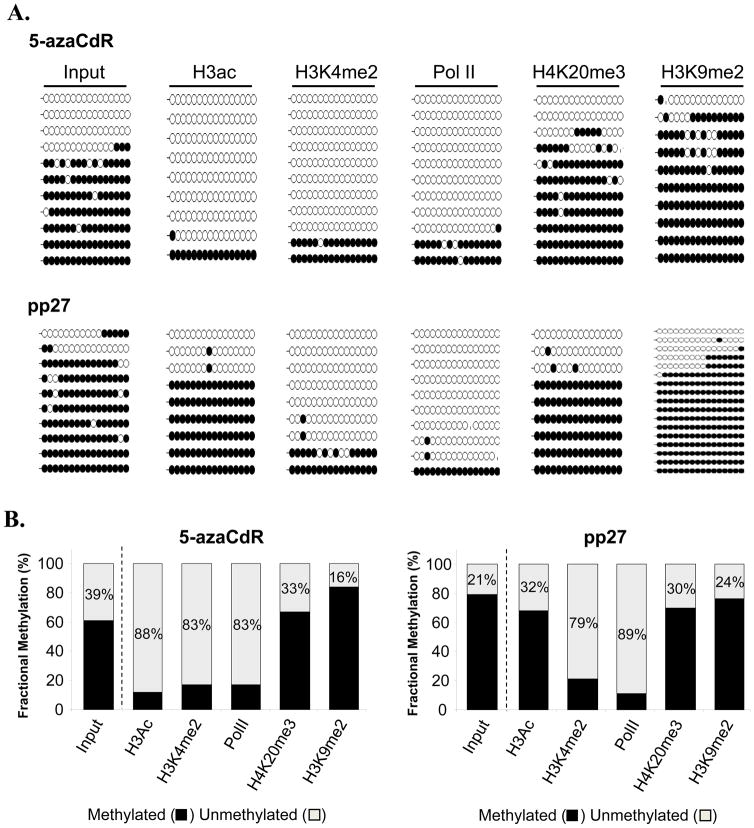
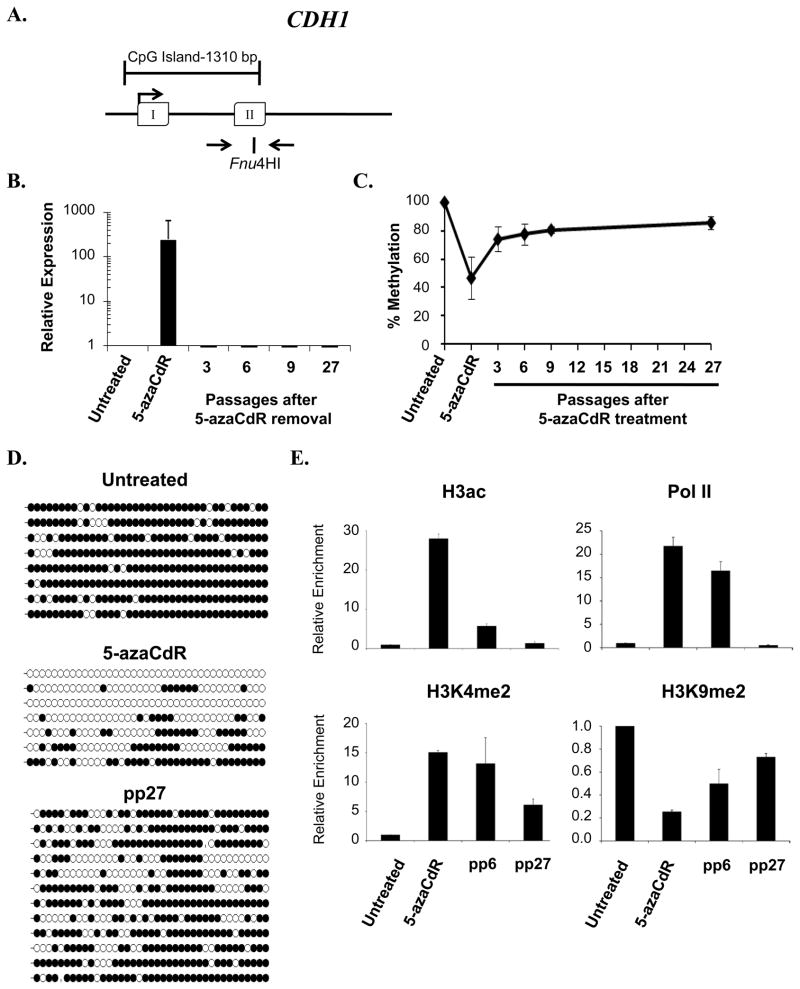
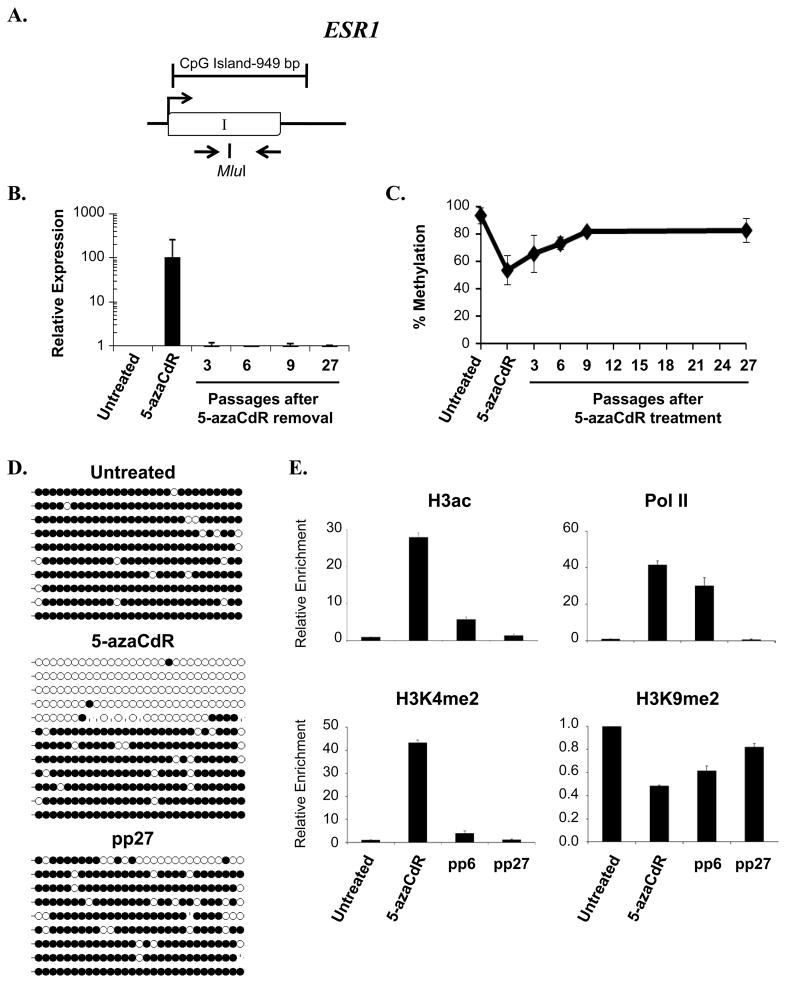
DNA methyltransferase inhibitors are currently the standard of care for myelodysplastic syndrome and are in clinical trials for leukemias and solid tumors. However, the molecular basis underlying their activity remains poorly understood. Here, we studied the induction and long-term stability of gene reactivation at three methylated tumor suppressor loci in response to the DNA methyltransferase inhibitor 5-aza-2'-deoxycytidine (5-azaCdR) in human breast cancer cells. At the TMS1/ASC locus, treatment with 5-azaCdR resulted in partial DNA demethylation, the reengagement of RNA polymerase II (Pol II), and a shift from a repressive chromatin profile marked with H3K9me2 and H4K20me3 to an active profile enriched in H3ac and H3K4me2. Using a single-molecule approach coupling chromatin immunoprecipitation with bisulfite sequencing, we show that H3ac, H3K4me2, and Pol II selectively associated with the demethylated alleles, whereas H3K9me2 preferentially marked alleles resistant to demethylation. H4K20me3 was unaffected by DNA demethylation and associated with both unmethylated and methylated alleles. After drug removal, TMS1 underwent partial remethylation, yet a subset of alleles remained stably demethylated for over 3 months. These alleles remained selectively associated with H3K4me2, H3ac, and Pol II and correlated with a sustained low level of gene expression. TMS1 alleles reacquired H3K9me2 over time, and those alleles that became remethylated retained H3ac. In contrast, CDH1 and ESR1 were remethylated and completely silenced within approximately 1 week of drug removal, and failed to maintain stably unmethylated alleles. Our data suggest that the ability to maintain Pol II occupancy is a critical factor in the long-term stability of drug-induced CpG island demethylation.
Figures
Similar articles
-
Demethylation by 5-aza-2'-deoxycytidine in colorectal cancer cells targets genomic DNA whilst promoter CpG island methylation persists.BMC Cancer. 2010 Jul 12;10:366. doi: 10.1186/1471-2407-10-366. BMC Cancer. 2010. PMID: 20618997 Free PMC article.
-
Methylation-mediated silencing of TMS1/ASC is accompanied by histone hypoacetylation and CpG island-localized changes in chromatin architecture.J Biol Chem. 2002 Feb 15;277(7):4951-8. doi: 10.1074/jbc.M109809200. Epub 2001 Dec 3. J Biol Chem. 2002. PMID: 11733524
-
Aberrant methylation and silencing of ARHI, an imprinted tumor suppressor gene in which the function is lost in breast cancers.Cancer Res. 2003 Jul 15;63(14):4174-80. Cancer Res. 2003. PMID: 12874023
-
Factors affecting the persistence of drug-induced reprogramming of the cancer methylome.Epigenetics. 2016 Apr 2;11(4):273-87. doi: 10.1080/15592294.2016.1158364. Epub 2016 Apr 15. Epigenetics. 2016. PMID: 27082926 Free PMC article.
-
Epigenetic therapy of cancer with 5-aza-2'-deoxycytidine (decitabine).Semin Oncol. 2005 Oct;32(5):443-51. doi: 10.1053/j.seminoncol.2005.07.008. Semin Oncol. 2005. PMID: 16210084 Review.
Cited by
-
Incorporating DNA Methyltransferase Inhibitors (DNMTis) in the Treatment of Genitourinary Malignancies: A Systematic Review.Target Oncol. 2018 Feb;13(1):49-60. doi: 10.1007/s11523-017-0546-x. Target Oncol. 2018. PMID: 29230671 Free PMC article.
-
Inhibition of DNA methylation in newborns reprograms ischemia-sensitive biomarkers resulting in development of a heart ischemia-sensitive phenotype late in life.Reprod Toxicol. 2021 Oct;105:198-210. doi: 10.1016/j.reprotox.2021.09.007. Epub 2021 Sep 15. Reprod Toxicol. 2021. PMID: 34536542 Free PMC article.
-
DNA Hypomethylating Drugs in Cancer Therapy.Cold Spring Harb Perspect Med. 2017 May 1;7(5):a026948. doi: 10.1101/cshperspect.a026948. Cold Spring Harb Perspect Med. 2017. PMID: 28159832 Free PMC article. Review.
-
DNA methylation does not stably lock gene expression but instead serves as a molecular mark for gene silencing memory.Cancer Res. 2012 Mar 1;72(5):1170-81. doi: 10.1158/0008-5472.CAN-11-3248. Epub 2012 Jan 4. Cancer Res. 2012. PMID: 22219169 Free PMC article.
-
DNA hypomethylation upregulates expression of the MGAT3 gene in HepG2 cells and leads to changes in N-glycosylation of secreted glycoproteins.Sci Rep. 2016 Apr 13;6:24363. doi: 10.1038/srep24363. Sci Rep. 2016. PMID: 27073020 Free PMC article.
References
-
- Bird AP. CpG-rich islands and the function of DNA methylation. Nature. 1986;321:209–13. - PubMed
-
- Lander ES, Linton LM, Birren B, Nusbaum C, Zody MC, Baldwin J, et al. Initial sequencing and analysis of the human genome. Nature. 2001;409:860–921. - PubMed
-
- Baylin SB. DNA methylation and gene silencing in cancer. Nat Clin Pract Oncol. 2005;2 (Suppl 1):S4–11. - PubMed
-
- Jenuwein T, Allis CD. Translating the histone code. Science. 2001;293:1074–80. - PubMed
Publication types
MeSH terms
Substances
Grants and funding
LinkOut - more resources
Full Text Sources
Other Literature Sources
Miscellaneous
