. 2010 Aug 1;123(Pt 15):2565-75.
doi: 10.1242/jcs.064089. Epub 2010 Jun 29.

Co-regulation of nuclear respiratory factor-1 by NFkappaB and CREB links LPS-induced inflammation to mitochondrial biogenesis

Affiliations

Co-regulation of nuclear respiratory factor-1 by NFkappaB and CREB links LPS-induced inflammation to mitochondrial biogenesis

Hagir B Suliman et al. J Cell Sci. .

Abstract

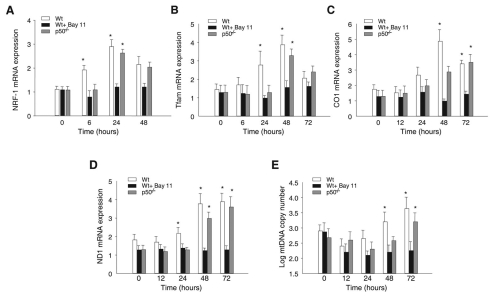
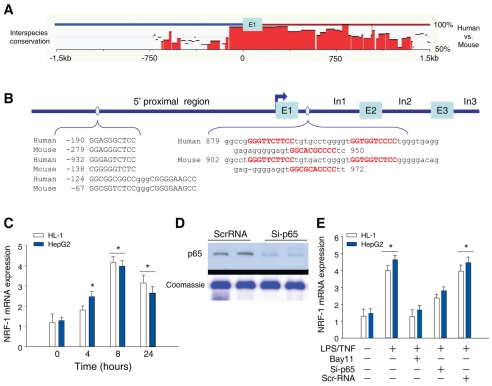
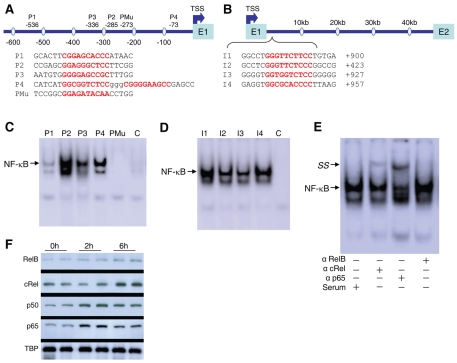
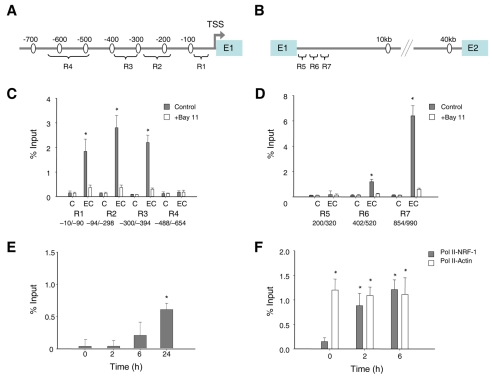
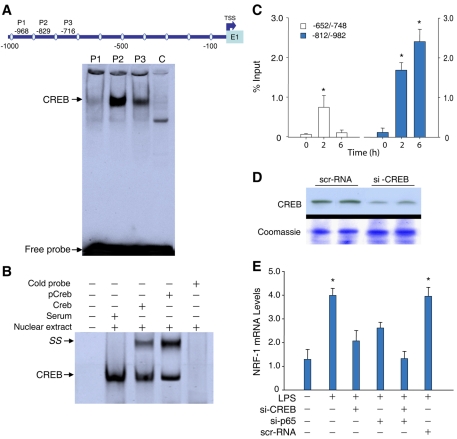
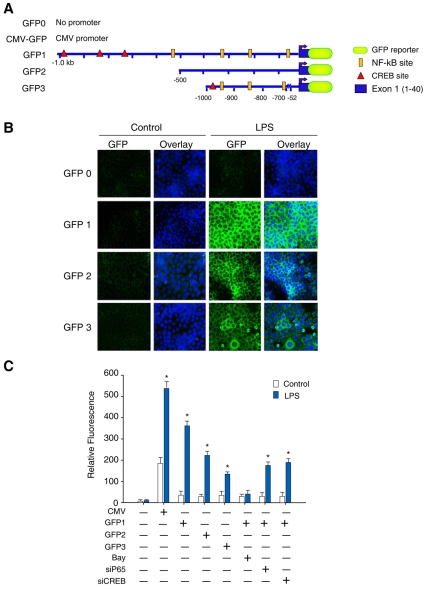
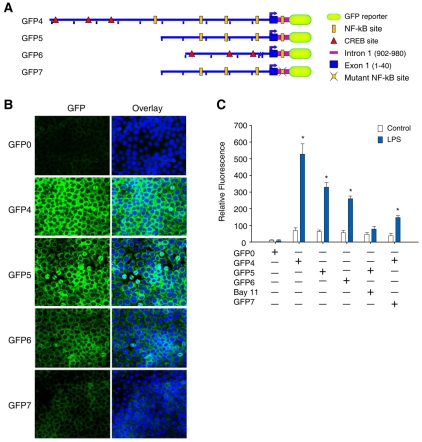
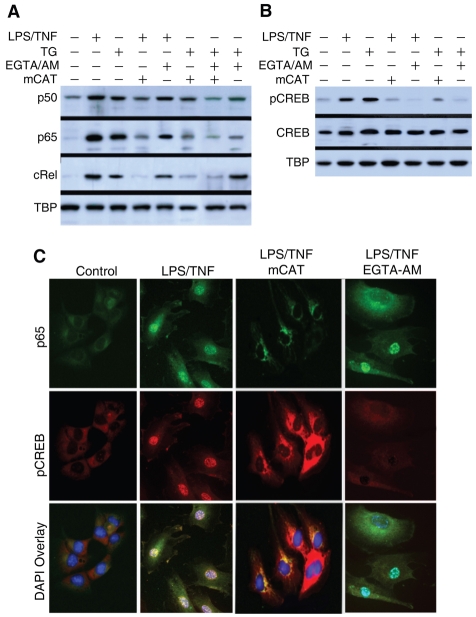
The nuclear respiratory factor-1 (NRF1) gene is activated by lipopolysaccharide (LPS), which might reflect TLR4-mediated mitigation of cellular inflammatory damage via initiation of mitochondrial biogenesis. To test this hypothesis, we examined NRF1 promoter regulation by NFκB, and identified interspecies-conserved κB-responsive promoter and intronic elements in the NRF1 locus. In mice, activation of Nrf1 and its downstream target, Tfam, by Escherichia coli was contingent on NFκB, and in LPS-treated hepatocytes, NFκB served as an NRF1 enhancer element in conjunction with NFκB promoter binding. Unexpectedly, optimal NRF1 promoter activity after LPS also required binding by the energy-state-dependent transcription factor CREB. EMSA and ChIP assays confirmed p65 and CREB binding to the NRF1 promoter and p65 binding to intron 1. Functionality for both transcription factors was validated by gene-knockdown studies. LPS regulation of NRF1 led to mtDNA-encoded gene expression and expansion of mtDNA copy number. In cells expressing plasmid constructs containing the NRF-1 promoter and GFP, LPS-dependent reporter activity was abolished by cis-acting κB-element mutations, and nuclear accumulation of NFκB and CREB demonstrated dependence on mitochondrial H(2)O(2). These findings indicate that TLR4-dependent NFκB and CREB activation co-regulate the NRF1 promoter with NFκB intronic enhancement and redox-regulated nuclear translocation, leading to downstream target-gene expression, and identify NRF-1 as an early-phase component of the host antibacterial defenses.


Figures

Fig. 1.
Fig. 1.
NFκB-dependent activation of Nrf1 and downstream NRF1 target-gene expression in mice. Timed experiments for the effects of administration of heat-inactivated E. coli in wild-type BAY11-treated mice and p50−/− mice. (A) Hepatic Nrf1 mRNA expression determined by real time RT-PCR. (B) Hepatic Tfam mRNA expression by real time RT-PCR. (C) Hepatic mitochondrial CO1 (Mtco1) mRNA expression by real time RT-PCR. (D) Hepatic mitochondrial ND1 (Mtnd1) mRNA expression by real time RT-PCR. (E) Hepatic mitochondrial DNA copy number determined by real time PCR. Values are means ± s.e. of 4-6 mouse livers (*P<0.05).
Fig. 2.
Fig. 2.
Bioinformatics analysis of the 5′-proximal region of the NRF1 gene promoter and conserved region of intron 1 in the mouse and human. (A) Sequences were aligned between human and mouse using rVISTA 2.0. The middle histogram represents the interspecies DNA conservation within the 5′-UTR segment. CNS (interspecies conservation more than 75%) is emphasized in red. (B) The first three exons (E) and the first three introns (In) for the NRF1 gene are shown. NFκB consensus sequences for human and mouse NRF1 genes identified by Genomatix and DNAsis are displayed on the blue line under the histograms. Detailed sequences spanning promoter and intron NFκB motifs are depicted at the bottom. Red letters indicate the NFκB consensus sequences. (C) Timed NRF-1 induction in human HepG2 and mouse HL-1 cells after LPS +TNFα exposure (10 ng/ml each). (D) Western blot for p65 in HepG2 cells transfected with control siRNA or p65 siRNA. (E) NRF-1 expression in HepG2 and HL-1 cells before and 8 hours after incubation with LPS+TNFα. Cells with BAY11 (50 μM) were pretreated for 1 hour before addition of LPS+TNF. Cells with control siRNA or siRNA targeting p65 (si-p65) were transfected 48 hours before LPS+TNF treatment for 8 hours. NRF1 mRNA expression was determined by q-RT-PCR. Values with error bars are means ± s.e. of four replicates (*P<0.05).
Fig. 3.
Fig. 3.
Gel-shift analyses using oligonucleotide probes for NFκB in the Nrf1 locus. The probes are listed below the maps of the (A) 5′-proximal region and (B) intron 1 region. A mutant (Mu) probe was also used. Nuclear extracts from wild-type mice with or without E. coli administration were prepared from fresh liver and used for gel-shift analysis with different NFκB consensus probes from Nrf1. Arrows indicate NFκB complexes. (C) Gel-shift experiments using NFκB-motif containing probes; lanes 1-4 are nuclear extract from livers of wild-type mice 2 hours after addition of E. coli using 32P-labeled oligonucleotides derived from the Nrf1 promoter (labeled P1-P4, respectively). A mutant oligonucleotide was used in lane 5, and lane 6 is nuclear extract from control mouse liver using oligonucleotide P2. (D) Gel-shift on mouse liver nuclear extracts at 2 hours after E. coli exposure using the intronic region oligonucleotides I1-I4. (E) EMSA of wild-type mouse liver nuclear protein 2 hours after E. coli exposure. Nuclear protein was incubated with 32P-labeled NFκB recognition site (P2) and with serum or polyclonal anti-RelB, anti-cRel or anti-p65. The supershift complex is indicated by SS. The cRel and p65 supershifts are typical of three experiments. (F) Representative nuclear western blots of NFκB subunits in wild-type mouse liver after E. coli treatment. TBP was detected as a loading control.
Fig. 4.
Fig. 4.
ChIP analysis for NFκB occupancy at the Nrf1 promoter and intronic sites. (A) Primer locations for ChIP and quantitative real-time PCR at the 5′-proximal regions of Nrf1 (R1, R2, R3, R4). (B) Locations of primers for ChIP and quantitative real-time PCR at intron 1 of Nrf1 (regions R5, R6, and R7). (C) Hepatic ChIP analysis for promoter regions R1-4 in control (C) and E. coli-treated (EC) mice with or without the NFκB inhibitor BAY11. (D) Hepatic ChIP analysis for intron regions R5-7 of control (C) and E. coli-treated (EC) mice with or without BAY11. Rabbit anti-p65 antibody (Cell Signaling) was used for the ChIP assay and quantification of immunoprecipitated DNA fragments was performed by real-time PCR. Values in C and D were normalized to corresponding input control (*P<0.01 compared with BAY11. Data are means ± s.e. for 4-6 experiments). (E) ChIP analysis of liver nuclei pre- and at 2, 6 and 24 hours after E. coli (anti-cRel antibody; Santa Cruz). (F) ChIP confirmation of occupancy of the RNA PolII transcription complex in the NRF-1 and β-actin gene promoters using antibody against RNA PolII at 0, 2 and 6 hours after the mice received HKEC. Values for E and F were normalized to corresponding input control (*P<0.05 compared with time 0. Data in E and F are means ± s.e. of four experiments).
Fig. 5.
Fig. 5.
CREB activation by EMSA and ChIP assay. (A) Liver nuclear extracts from mice treated with E. coli were incubated with 32P-labeled oligonucleotide probes containing CREB consensus sites from the Nrf1 promoter (see map). Lane 1, probe P1 at −968 ttGGAGGTCAgc; lane 2, probe P2 at −829 tcTGACACCAtg; lane 3, probe P3 at −716 ctGATGACAtaa; lane 4, control (C) nuclear extract. (B) CREB activation measured by EMSA. Incubation of 32P-labeled −829-tcTGACACCAtg with nuclear extract and total or phosphorylated CREB antibody, but not serum, supershifted the complex (SS). Cold probe (100-fold excess) eliminated the CREB-specific complex (arrow). (C) ChIP analysis of liver nuclei of control and E. coli-treated mice using anti-CREB antibody (Santa Cruz) at 0, 2 and 6 hour time points. (D) Western blot for HepG2 cells transfected with scrambled siRNA or CREB siRNA showing CREB silencing. (E) NRF-1 expression in control cells or cells treated with LPS and transfected with p65 siRNA, CREB siRNA, or both. Histograms show mean ± s.e. of 4-6 experiments at 8 hours after LPS (*P<0.05 vs control).
Fig. 6.
Fig. 6.
Functional cis-acting elements in the NRF1 promoter. NFκB and CREB function at the NRF1 promoter was established in HepG2 cells transfected with plasmid pGlow (GFP0) containing no promoter region (negative control) or plasmids harboring regions −500 to +40 (GFP2) or a chimeric promoter for −1000 to −700 plus −52 to +40 bp (GFP3) of the NFR1 gene. To assess additive effects of the two elements spanning −1000 to +40 of NRF-1, transfection was also carried out using promoter −1000 to +40 (GFP1). (A) Schematic representations of various plasmids used in the transfection assays are labeled on the left (drawings are not to scale). Plasmids pCMV-GFP and GFP0 plasmid were used as positive and negative controls, respectively. (B) HepG2 cells transfected with the GFP plasmids. The activity of each construct was measured before and 24 hours after LPS. Green indicates GFP expression driven by the NRF1 promoter construct by fluorescence microscopy. The blue fluorescence is nuclear staining with DAPI. (C) Relative activity of each construct measured before and after 24 hours of LPS treatment. The activity of construct GFP1 was measured as fluorescence intensity after treatment of cells with the NFκB inhibitor BAY11 or after co-transfection with p65 or CREB siRNA. Comparative fluorescence intensity represents means ± s.e. of three independent studies performed with plasmids in triplicate (*P<0.05).
Fig. 7.
Fig. 7.
NFκB binding in intron 1 enhances NRF1 promoter activity. (A) Schematic representations of various plasmids used in the transfection assay are given on the left. The plasmid drawings are not to the scale. Plasmids pCMV-GFP and GFP0 plasmid were used as positive and negative controls, respectively. The reporter constructs are GFP0 (negative control), pCMV-GFP (positive control); GFP4, containing the 1040 bp region at the 5′ site (−1000 to +40 bp of exon 1) plus the 78 bp region of intron 1; GFP5, containing the 540 bp region at the 5′ site (−500 to +40) plus the 78 bp region of intron 1; GFP6, containing the 78 bp of intron 1 region of the NFκB sites plus the chimeric promoter region (−352 to +40 bp of exon 1), and GFP7, containing the mutation at intronic NFκB sites within 78 bp plus the region from plasmid GFP5. (B) HepG2 cells transfected with the respective plasmids. The activity of each construct was measured before and after 24 hours of LPS treatment. Green fluorescence represents GFP expression driven by NRF1 promoter and intronic constructs detected by fluorescence microscopy. The blue fluorescence is nuclear staining with DAPI. (C) Ratio of observed fluorescence intensity to the basal level for GFP0 or to untreated controls. The relative activity of each construct was measured before and 24 hours after LPS treatment. GFP4 activity was measured after treatment of cells with BAY11. Relative fluorescence intensity represents mean ± s.e. of three studies performed with plasmids in triplicate (*P<0.01 vs GFP1 and P<0.05 vs BAY11).
Fig. 8.
Fig. 8.
Role of reactive oxygen species and calcium on LPS-induced activation of NFκB and CREB. (A) Nuclear western blots of p65, p50 and cRel protein in cells transfected with mCAT or empty vector for 48 hours before administration of LPS and TNF. In some experiments, cells were treated with Ca2+ chelator (20 μM EGTA-AM) or with 30 nM thapsigargin (TG), or both for 30 minutes followed by LPS and TNF for 2 hours. Nuclear extracts were immunoblotted with anti-p65, anti-p50, anti-cRel or anti-TBP. (B) Nuclear western blots of pCREB and total CREB protein in cells with or without mCAT transfection 48 hours before LPS and TNF treatment. In some experiments, cells were treated with 20 μM EGTA-AM or with 30 nM TG or both for 30 minutes followed by LPS and TNF for 2 hours. Nuclear extracts were immunoblotted with antibodies against phosphorylated CREB, CREB or TBP. (C) Confocal images of control HL-1 cells with or without mCAT transfection 48 hours before treatment with LPS and TNF. In some experiments, cells were treated with 20 μM EGTA-AM for 30 minutes followed by LPS and TNF for 2 hours. Cells were stained with anti-p65 (green) or with anti-pCREB (red) antibodies and nuclei were visualized with DAPI (blue).

Similar articles

Cited by

References

    1. Adler A. S., Sinha S., Kawahara T. L., Zhang J. Y., Segal E., Chang H. Y. (2007). Motif module map reveals enforcement of aging by continual NF-kappaB activity. Genes Dev. 21, 3244-3257 - PMC - PubMed
    1. Bakkar N., Wang J., Ladner K. J., Wang H., Dahlman J. M., Carathers M., Acharyya S., Rudnicki M. A., Hollenbach A. D., Guttridge D. C. (2008). IKK/NF-kappaB regulates skeletal myogenesis via a signaling switch to inhibit differentiation and promote mitochondrial biogenesis. J. Cell Biol. 180, 787-802 - PMC - PubMed
    1. Beg A. A., Finco T. S., Nantermet P. V., Baldwin A. S., Jr (1993). Tumor necrosis factor and interleukin-1 lead to phosphorylation and loss of I kappa B alpha: a mechanism for NF-kappa B activation. Mol. Cell. Biol. 13, 3301-3310 - PMC - PubMed
    1. Bergeron R., Ren J. M., Cadman K. S., Moore I. K., Perret P., Pypaert M., Young L. H., Semenkovich C. F., Shulman G. I. (2001). Chronic activation of AMP kinase results in NRF-1 activation and mitochondrial biogenesis. Am. J. Physiol. Endocrinol. Metab. 281, E1340-E1346 - PubMed
    1. Charital Y. M., van Haasteren G., Massiha A., Schlegel W., Fujita T. (2009). A functional NF-kappaB enhancer element in the first intron contributes to the control of c-fos transcription. Gene 430, 116-122 - PubMed

Publication types

MeSH terms