Technical advance: Caspase-1 activation and IL-1β release correlate with the degree of lysosome damage, as illustrated by a novel imaging method to quantify phagolysosome damage
- PMID: 20587739
- PMCID: PMC2974426
- DOI: 10.1189/jlb.0310159
Technical advance: Caspase-1 activation and IL-1β release correlate with the degree of lysosome damage, as illustrated by a novel imaging method to quantify phagolysosome damage
Abstract
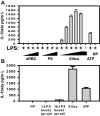
In addition to the lysosome's important roles in digestion, antigen processing, and microbial destruction, lysosome damage in macrophages can trigger cell death and release of the inflammatory cytokine IL-1β. To examine the relationship among endocytosis, lysosome damage, and subsequent events, such as caspase-1 activation and IL-1β secretion, we developed a method for measuring lysosome disruption inside individual living cells, which quantifies release of Fdx from lysosomes. Unperturbed, cultured BMM exhibited low levels of lysosome damage, which were not increased by stimulation of macropinocytosis. Lysosome damage following phagocytosis differed with different types of ingested particles, with negligible damage after ingestion of sRBC ghosts, intermediate damage by polystyrene (PS) beads, and high levels of damage by ground silica. Pretreatment with LPS decreased the amount of lysosome damage following phagocytosis of PS beads, silica microspheres, or ground silica. Activation of caspase-1 and subsequent release of IL-1β were proportional to lysosome damage following phagocytosis. The low level of damage following PS bead phagocytosis was insufficient to activate caspase-1 in LPS-activated macrophages. These studies indicate that lysosome damage following phagocytosis is dependent on particle composition and dose and that caspase-1 activation and IL-1β secretion correlate with the extent of lysosome damage.
Figures


Similar articles
-
Extracellular cathepsin S and intracellular caspase 1 activation are surrogate biomarkers of particulate-induced lysosomal disruption in macrophages.Part Fibre Toxicol. 2016 Apr 23;13:19. doi: 10.1186/s12989-016-0129-5. Part Fibre Toxicol. 2016. PMID: 27108091 Free PMC article.
-
Coordinated host responses during pyroptosis: caspase-1-dependent lysosome exocytosis and inflammatory cytokine maturation.J Immunol. 2011 Sep 1;187(5):2748-54. doi: 10.4049/jimmunol.1100477. Epub 2011 Jul 29. J Immunol. 2011. PMID: 21804020 Free PMC article.
-
Nonclassical IL-1 beta secretion stimulated by P2X7 receptors is dependent on inflammasome activation and correlated with exosome release in murine macrophages.J Immunol. 2007 Aug 1;179(3):1913-25. doi: 10.4049/jimmunol.179.3.1913. J Immunol. 2007. PMID: 17641058
-
The secretion of IL-1β and options for release.Semin Immunol. 2013 Dec 15;25(6):425-9. doi: 10.1016/j.smim.2013.10.007. Epub 2013 Nov 5. Semin Immunol. 2013. PMID: 24201029 Review.
-
Caspase-11: the driving factor for noncanonical inflammasomes.Eur J Immunol. 2013 Sep;43(9):2240-5. doi: 10.1002/eji.201343800. Eur J Immunol. 2013. PMID: 24037676 Review.
Cited by
-
NLRP3 inflammasome activation in murine alveolar macrophages and related lung pathology is associated with MWCNT nickel contamination.Inhal Toxicol. 2012 Dec;24(14):995-1008. doi: 10.3109/08958378.2012.745633. Inhal Toxicol. 2012. PMID: 23216160 Free PMC article.
-
Uncovering the secretes of allergic inflammation.J Clin Invest. 2020 Jul 1;130(7):3419-3421. doi: 10.1172/JCI138343. J Clin Invest. 2020. PMID: 32510472 Free PMC article.
-
Crystalline silica induces macrophage necrosis and causes subsequent acute pulmonary neutrophilic inflammation.Cell Biol Toxicol. 2022 Aug;38(4):591-609. doi: 10.1007/s10565-021-09620-1. Epub 2021 Jun 25. Cell Biol Toxicol. 2022. PMID: 34170461
-
Lipopolysaccharides may aggravate apoptosis through accumulation of autophagosomes in alveolar macrophages of human silicosis.Autophagy. 2015;11(12):2346-57. doi: 10.1080/15548627.2015.1109765. Autophagy. 2015. PMID: 26553601 Free PMC article.
-
Renitence vacuoles facilitate protection against phagolysosomal damage in activated macrophages.Mol Biol Cell. 2018 Mar 1;29(5):657-668. doi: 10.1091/mbc.E17-07-0486. Epub 2017 Dec 27. Mol Biol Cell. 2018. PMID: 29282279 Free PMC article.
References
-
- Scott C. C., Botelho R. J., Grinstein S. (2003) Phagosome maturation: a few bugs in the system. J. Membr. Biol. 193, 137–152 - PubMed
-
- Christensen K. A., Myers J. T., Swanson J. A. (2002) pH-Dependent regulation of lysosomal calcium in macrophages. J. Cell Sci. 115, 599–607 - PubMed
-
- Burgdorf S., Kurts C. (2008) Endocytosis mechanisms and the cell biology of antigen presentation. Curr. Opin. Immunol. 20, 89–95 - PubMed
-
- Ray K., Marteyn B., Sansonetti P. J., Tang C. M. (2009) Life on the inside: the intracellular lifestyle of cytosolic bacteria. Nat. Rev. Microbiol. 7, 333–340 - PubMed

