Comparative Study
. 2010 Jun;22(6):2058-84.
doi: 10.1105/tpc.109.071167. Epub 2010 Jun 29.

RNA-seq analysis of sulfur-deprived Chlamydomonas cells reveals aspects of acclimation critical for cell survival

Affiliations
Comparative Study

RNA-seq analysis of sulfur-deprived Chlamydomonas cells reveals aspects of acclimation critical for cell survival

David González-Ballester et al. Plant Cell. 2010 Jun.

Erratum in

  • Plant Cell. 2011 Apr;23(4):1679-81

Abstract

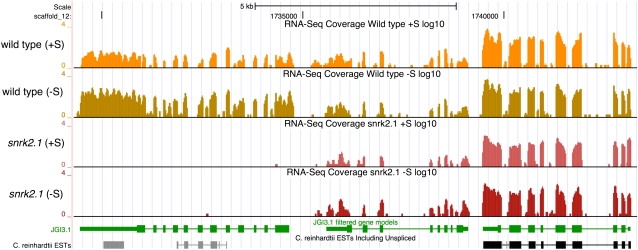
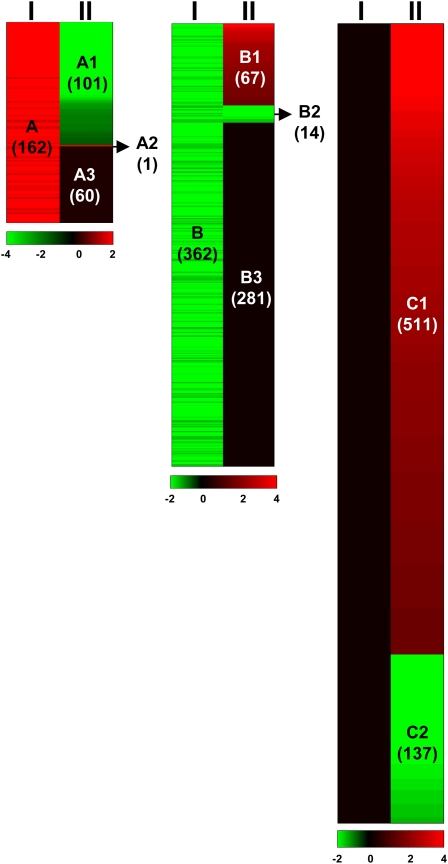
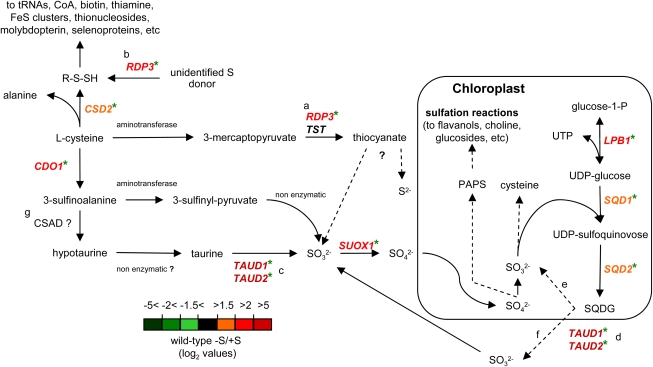
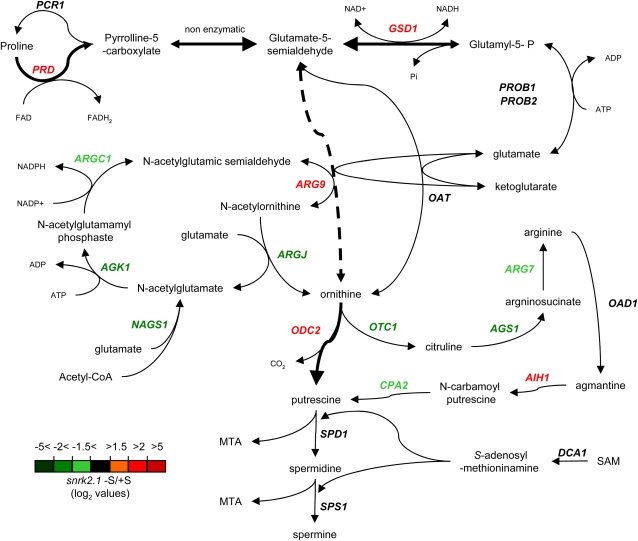
The Chlamydomonas reinhardtii transcriptome was characterized from nutrient-replete and sulfur-depleted wild-type and snrk2.1 mutant cells. This mutant is null for the regulatory Ser-Thr kinase SNRK2.1, which is required for acclimation of the alga to sulfur deprivation. The transcriptome analyses used microarray hybridization and RNA-seq technology. Quantitative RT-PCR evaluation of the results obtained by these techniques showed that RNA-seq reports a larger dynamic range of expression levels than do microarray hybridizations. Transcripts responsive to sulfur deprivation included those encoding proteins involved in sulfur acquisition and assimilation, synthesis of sulfur-containing metabolites, Cys degradation, and sulfur recycling. Furthermore, we noted potential modifications of cellular structures during sulfur deprivation, including the cell wall and complexes associated with the photosynthetic apparatus. Moreover, the data suggest that sulfur-deprived cells accumulate proteins with fewer sulfur-containing amino acids. Most of the sulfur deprivation responses are controlled by the SNRK2.1 protein kinase. The snrk2.1 mutant exhibits a set of unique responses during both sulfur-replete and sulfur-depleted conditions that are not observed in wild-type cells; the inability of this mutant to acclimate to S deprivation probably leads to elevated levels of singlet oxygen and severe oxidative stress, which ultimately causes cell death. The transcriptome results for wild-type and mutant cells strongly suggest the occurrence of massive changes in cellular physiology and metabolism as cells become depleted for sulfur and reveal aspects of acclimation that are likely critical for cell survival.


Figures

Figure 1.
Figure 1.
Model for S Deprivation–Responsive Gene Regulation. (A) and (B) Simplified diagrams of gene regulation in wild-type cells in +S and –S conditions, respectively. (A) In the presence of S, SAC1 is inactive and SNRK2.2 inhibits SNRK2.1-activated expression of S-responsive genes, leading to basal level expression. (B) In S-deficient conditions, active SAC1 blocks SNRK2.2 inhibition of SNRK2.1, allowing full expression of S-responsive genes. This model is based on one previously developed by Moseley et al. (2009).
Figure 2.
Figure 2.
RNA-Seq Coverage for a 14-kb Region of the Chlamydomonas Genome as Displayed by the UCSC Genome Browser. Individual tracks for each Chlamydomonas strain and condition discussed in the article are displayed in different colors. The x axis represents a genome fragment with the linear arrangement of gene models along that fragment, while the y axis provides a representation of the degree of transcript coverage in log scale. JGI v.3.1 gene models and ESTs tracks are displayed at the bottom. See Supplemental Methods online for more details. The most 5′ gene model (left-hand side) corresponds to the AOT4 locus, a putative amino acid/polyamine transporter with increased expression in S-deprived wild-type cells that is barely expressed in snrk2.1 cells (under both +S and −S conditions).
Figure 3.
Figure 3.
Cluster Diagrams Depicting the Fold Change in Transcript Levels Determined by RNA-Seq. The log2 relative expression values of 1.5 and −1.5 were selected as the thresholds to designate the categories of transcripts that accumulate (or are more abundant) and decline (or are less abundant), respectively, for wild type –S/wild type +S (I) and snrk2.1 –S/wild type –S (II) conditions. For more details about each of the categories, see Methods. The number of different transcripts in each category is indicated in the appropriate sector. Areas are proportional to the numbers of genes within the specific category. A short description of each category is given below. A, transcripts that accumulate in wild-type cells in –S conditions; A1, transcripts that accumulate in wild-type cells in –S conditions and that are relatively less abundant in the mutant in –S conditions; A2, transcripts that accumulate in wild-type cells in –S conditions and that are relatively more abundant in the mutant in –S conditions; A3, transcripts that accumulate in wild-type cells to approximately the same extent as in mutant cells in –S conditions; B, transcripts that decline in wild-type cells in –S conditions; B1, transcripts that decline in wild-type cells in –S conditions and that are relatively more abundant in mutant cells in –S conditions; B2, transcripts that decline in wild-type cells in –S conditions and that are relatively less abundant in mutant cells in –S conditions; B3, transcripts that decline in wild-type cells and decline to approximately the same extent in mutant cells in –S conditions; C1, transcripts that are more abundant in mutant cells than in wild-type cells in –S conditions and that do not change significantly in wild-type cells in –S conditions; C2, transcripts that are less abundant in mutant cells than in wild-type cells in –S conditions and that do not change significantly in wild-type cells in –S conditions. Additional information for all genes included in this figure can be found in Table 1 and Supplemental Data Set 2 online.
Figure 4.
Figure 4.
A Comparison of Fold Change (Log2) Values of Transcript Levels Measured by RNA-Seq, Microarrays, and qRT-PCR. (A) Fold change (log2) values for individual transcripts between two experimental conditions in which the RNA levels were quantified by microarray analyses (x axis) and were then compared with corresponding values calculated from RNA-seq experiments (y axis). (B) Fold change (log2) values for individual transcripts between two experimental conditions in which the RNA levels were quantified by qRT-PCR analyses (x axis) and then compared with corresponding values obtained by RNA-seq experiments (y axis). The pairs of experimental conditions compared include wild type −S/wild type +S; snrk2.l –S/wild type –S; snrk2.1 +S/wild type +S, with all time points for –S corresponding to 6 h after the onset of S deprivation.
Figure 5.
Figure 5.
Pathways for S Acquisition and Assimilation. Genes encoding the proteins of these pathways are labeled with colors, indicating the fold change (log2) of their transcript levels under S deprivation relative to nutrient-replete conditions for wild-type cells based on RNA-seq data (color code is given in the figure). The proteins encoded by each of the genes represented in the pathway diagram are given in Table 3. Dashed lines represent multiple metabolic steps. Asterisks represent genes that showed altered expression in snrk2.1 mutant relative to wild-type cells upon S deprivation. APS, adenosine 5′-phosphosulfate; PAPS, adenosine 3′-phosphate 5′-phosphosulfate; S2−, sulfide; OAS, O-acetyl-serine; OPH, O-phosphohomoserine; SAH, S-adenosyl-homocysteine; S-a.a, sulfur-containing amino acids.
Figure 6.
Figure 6.
Abundances of Six Selected Transcripts under Different Nutrient Deprivation Conditions. RNA samples were extracted from wild-type cells for qRT-PCR analysis at 6 h following their transfer to the different media (NR, nutrient-replete; −S, S-depleted; −P, phosphorus-depleted; −N, nitrogen-depleted). Levels of individual transcripts noted in (A) to (F) are given as relative fold abundance with respect to the housekeeping control gene (CBLP) and then multiplying relative target gene abundances by a factor of 104. Each of the values was from at least three replicates, with the error bars representing 1 sd. Graphics are in log scale; note the different scales for the different analyses.
Figure 7.
Figure 7.
Proposed Pathways for Redistribution and Recycling of S. The “a” and “b” denote two possible functions for RDP3; “c” and “d” denote two possible functions for TAUD1 and TAUD2; “e” and “f” denote two possible subcellular compartments in which SQDG degradation may occur; “g”, no gene encoding sulfinoalanine decarboxylase (CSAD) was identified on the Chlamydomonas genome. Other details are as in Figure 5. PAPS, adenosine 3′-phosphate 5′-phosphosulfate; S2−, sulfide.
Figure 8.
Figure 8.
Abundances of LHCBM Transcripts Based on qRT-PCR. (A) and (B) RNA samples were extracted from the wild type (A) and the snrk2.1 mutant (B) and analyzed for all nine of the LHCBM transcripts. (C) Comparisons of LHCBM9 expression levels in wild-type, snrk2.1, and sac1 cells. Levels of individual transcripts are given as relative fold abundances with respect to the housekeeping gene (CBLP) and then multiplying the relative target gene abundances by a factor of 10. Graphics are in log scale. Each of the values was from at least three replicates, with the error bars representing 1 sd. None of the values obtained were much below 1, and those values that were below 1 are represented as 0 on the graph.
Figure 9.
Figure 9.
Proposed Model for How the snrk2.1 Lesion Affects Photosynthesis and ROS Production Processes. Wild-type (wt) and mutant cells in nutrient-replete medium (A) perform photosynthesis at optimal levels with the consequent production of superoxide (O2) and H2O2. Under these conditions, transcripts encoding proteins related to O2 and H2O2 detoxification are relatively abundant, along with transcripts encoding Calvin-Benson-Bassham cycle-related enzymes. In wild-type cells that experience S deprivation (B), photosynthetic activity declines (most photosynthesis, chlorophyll biosynthesis, and Calvin-Benson-Bassham cycle-related transcripts decline), and the LHCBM1-8 proteins are partially replaced by LHCBM9. The production of O2 and H2O2 may be diminished because of reduced PSII activity and electron flow to PSI. Transcripts encoding proteins related to the detoxification of these specific ROS also decline. In the snrk2.1 mutant experiencing S deprivation (C), LHCBM9 is not synthesized and the PSII antenna may become reduced in size. This may impair the proper assembly of PSII and its capacity for photoprotection, triggering the production of singlet oxygen (1O2) and of genes specifically associated with 1O2 accumulation. Aberrant PSII architecture, 1O2 accumulation, and severe S deficiency could dramatically impair PSII function in the snrk2.1 mutant, resulting in a marked decline in electron flow to PSI. This decline in the photosynthetic activity would result in a decrease in the levels of transcripts encoding Calvin-Benson-Bassham cycle enzymes as well as those related to O2 and H2O2 accumulation. Accumulation of 1O2 may also trigger expression of genes potentially involved in the initiation of apoptosis (listed in Table 6). Thickness of the arrow between PSII and PSI depict a qualitative representation of the electron flow rate. See “ROS Detoxification and Cellular Redox” section for more details.
Figure 10.
Figure 10.
Alignments of the Amino Acid Sequences of Chlamydomonas LHCBM Proteins. The LHCBM9 polypeptide has substitutions at positions in which there are conserved S-containing amino acids in the other LHCBM proteins; these are Met157Leu, Met213Ser, and Cys101Ile; they are marked with an asterisk. The black and gray boxes indicate identical and similar amino acids, respectively. Alignments were performed using BioEdit 7.0.5.3 software.
Figure 11.
Figure 11.
Potential Pathways for Polyamine Biosynthesis. Genes encoding the proteins of the pathways are labeled with colors, indicating the fold change (log2) of their transcript levels under S deprivation conditions relative to nutrient-replete conditions for snrk2.1 cells based on RNA-seq data (color code is given in the figure). The dashed line indicates the alternative activities proposed for the ARG9 protein. The protein encoded by each of the genes represented in the pathway diagram is given in Table 6. MTA, S-methyl-5′-thioadenosine.

References

    1. Apel K., Hirt H. (2004). Reactive oxygen species: Metabolism, oxidative stress, and signal transduction. Annu. Rev. Plant Biol. 55: 373–399 - PubMed
    1. Asada K. (2006). Production and scavenging of reactive oxygen species in chloroplasts and their functions. Plant Physiol. 141: 391–396 - PMC - PubMed
    1. Audic S., Claverie J.M. (1997). The significance of digital gene expression profiles. Genome Res. 7: 986–995 - PubMed
    1. Bentley R., Chasteen T.G. (2004). Environmental VOSCs-formation and degradation of dimethyl sulfide, methanethiol and related materials. Chemosphere 55: 291–317 - PubMed
    1. Billheimer J.T., Cornvale H.N., Leisinger T., Eckhardt T., Jones E.E. (1976). Ornithine δ-transaminase in Escherichia coli: Its identity with acetylornithine δ-transaminase. J. Bacteriol. 127: 1315–1323 - PMC - PubMed

Publication types

MeSH terms

Associated data