. 2010 Jun;22(6):2085-101.
doi: 10.1105/tpc.109.073734. Epub 2010 Jun 29.

Sho1 and Msb2-related proteins regulate appressorium development in the smut fungus Ustilago maydis

Affiliations

Sho1 and Msb2-related proteins regulate appressorium development in the smut fungus Ustilago maydis

Daniel Lanver et al. Plant Cell. 2010 Jun.

Abstract

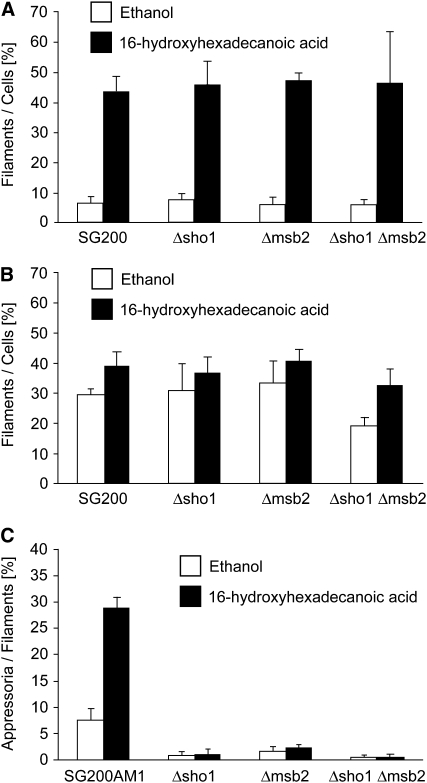
The dimorphic fungus Ustilago maydis switches from budding to hyphal growth on the plant surface. In response to hydrophobicity and hydroxy fatty acids, U. maydis develops infection structures called appressoria. Here, we report that, unlike in Saccharomyces cerevisiae and other fungi where Sho1 (synthetic high osmolarity sensitive) and Msb2 (multicopy suppressor of a budding defect) regulate stress responses and pseudohyphal growth, Sho1 and Msb2-like proteins play a key role during appressorium differentiation in U. maydis. Sho1 was identified through a two-hybrid screen as an interaction partner of the mitogen-activated protein (MAP) kinase Kpp6. Epistasis analysis revealed that sho1 and msb2 act upstream of the MAP kinases kpp2 and kpp6. Furthermore, Sho1 was shown to destabilize Kpp6 through direct interaction with the unique N-terminal domain in Kpp6, indicating a role of Sho1 in fine-tuning Kpp6 activity. Morphological differentiation in response to a hydrophobic surface was strongly attenuated in sho1 msb2 mutants, while hydroxy fatty acid-induced differentiation was unaffected. These data suggest that Sho1 and the transmembrane mucin Msb2 are involved in plant surface sensing in U. maydis.


Figures

Figure 1.
Figure 1.
Domain Architecture and Localization of U. maydis Sho1 and Msb2. (A)Top rows: Schematic representation of the domain structure of U. maydis Sho1 and S. cerevisiae Sho1p. Both proteins contain a noncleaved secretion signal (SignalP), four transmembrane domains, of which the first is part of the secretion signal, and a C-terminal SH3 domain. Bottom rows:Schematic representation of the domain structure of U. maydis Msb2 and S. cerevisiae Msb2p. Msb2 of U. maydis and Msb2p of S. cerevisiae share common features of signaling mucins. They have a cleaved signal peptide (SignalP) and one transmembrane domain close to the N terminus. The large extracellular part is Ser/Thr rich and includes tandem repeats. The short cytoplasmic tail contains a positively charged motif (RKHRK in U. maydis Msb2; RRR in S. cerevisiae Msb2p). aa, amino acids. (B) Localization of Sho1-GFP and Msb2-mCherry in U. maydis. SG200sho1GFP/msb2mCherry cells were grown to mid log phase in YEPSL and analyzed microscopically without addition (top row) or after addition of latrunculin (bottom row). The fluorescent signals corresponding to Sho1-GFP and Msb2-mCherry (middle columns) were merged (right column). Bright-field images are shown on the left.
Figure 2.
Figure 2.
Pathogenicity of sho1 and msb2 Mutant Strains in the SG200 Background. (A) The solopathogenic strain SG200 and its derivatives indicated below were spotted on PD charcoal plates and incubated for 24 h at 28°C. The white fuzzy colonies reflect the formation of b-dependent filaments. (B) Representative leaves 12 d after infection with the indicated strains. (C) Disease symptoms caused by SG200, sho1, and msb2 single mutants and sho1 msb2 double mutants in the SG200 background. The indicated strains were injected into maize seedlings and symptoms were scored 12 d after infection. Based on the severity of symptoms observed on each plant, symptoms were grouped into color-coded categories according to Kämper et al. (2006). Colors and patterns for disease scores are indicated to the right of (D). Three independent experiments were performed and the average values are expressed as a percentage of the total number of infected plants (n), which is given above each column. Tested strains are listed below each column. (D) Complementation of SG200-derived sho1 and msb2 single and double mutants. Plants were infected with the indicated strains and evaluated as described in (C).
Figure 3.
Figure 3.
Host Colonization Is Impaired in sho1 and msb2 Mutants. (A) Confocal projections of representative leaves 6 d after infection with the indicated strains. Plant tissue is shown at the layer of vascular bundles. Fungal material was stained by WGA-AF488 (green). Plant material was stained by propidium iodide (red). (B) Quantification of fungal biomass by quantitative PCR. U. maydis–specific and plant-specific primers were used to determine the relative fungal biomass in plants 3 d after infection with the indicated strains. Columns give ratios of fungal DNA to plant DNA, and the ratio in SG200-infected plants was set to 1.0. Means of three independent experiments with 30 leaves per strain are shown, and error bars indicate standard deviations.
Figure 4.
Figure 4.
Sho1 and Msb2 Affect Appressorium Formation on the Plant Surface. (A) Maize seedlings were infected with SG200AM1 and its derivatives as indicated. Eighteen hours after infection, the surface of the third oldest leaf was analyzed by confocal microscopy. Fungal hyphae were stained by calcofluor (blue), and expression of the AM1 marker (green) indicates appressorium formation. The overlays of maximum projections of both channels with the corresponding bright-field images are depicted. (B) Quantification of appressoria on the plant surface. Using the same strains as in (A), the average percentage of filaments that had formed appressoria to the total number of filaments was determined. For each strain (indicated below each column), >900 filaments were analyzed in three independent experiments. Error bars indicate standard deviations.
Figure 5.
Figure 5.
sho1 and msb2 Mutants Respond to Hydroxy Fatty Acid but Are Impaired in Their Response to Hydrophobic Surfaces. (A) Filamentation in liquid: The indicated strains (below each column) were tested for their response to 16-hydroxyhexadecanoic acid. Cells were incubated in liquid culture (2% YEPSL) supplemented with either 100 μM 16-hydroxyhexadecanoic acid dissolved in ethanol (black columns) or with ethanol (white columns) for 18 h at 28°C. The average percentage of cells that grew filamentously was determined by microscopy analysis. (B) Filamentation on a hydrophobic surface: Cell suspensions of the indicated strains in 2% YEPSL were sprayed on Parafilm M with 100 μM 16-hydroxyhexadecanoic acid dissolved in ethanol (black columns) or with ethanol (white columns) and incubated for 18 h at 28°C. After staining of fungal cells with calcofluor, the average percentage of cells that have formed filaments was determined microscopically. (C) Appressorium formation on a hydrophobic surface: SG200AM1 and its derivatives indicated below the columns were sprayed on a hydrophobic surface as described in (B), incubated for 18 h at 28°C, and stained with calcofluor. After microscopy analysis, the average percentage of cells that expressed the AM1 marker was determined relative to the cells that had formed filaments. In three independent experiments, >900 cells ([A] and [B]) or filaments (C) per strain were analyzed, and error bars indicate standard deviations.
Figure 6.
Figure 6.
Localization of Sho1-GFP and Msb2-mCherry in Appressoria. (A)to (D) SG200sho1GFP/otef:msb2mCherryHA was sprayed with 100 μM 16-hydroxyhexadecanoic acid on paraffin wax and incubated as described in Figure 5B. A section displaying two appressoria is analyzed. The appressorium on the right-hand side is magnified in the inset. (A) Calcofluor staining. (B) Visualization of Sho1-GFP (green). (C) Visualization of Msb2-mCherry (red). (D) Overlay of (B) and (C).
Figure 7.
Figure 7.
The Deletion of rok1 Suppresses the Virulence Phenotype of SG200Δsho1 Δmsb2. Maize plants were infected with SG200 and the indicated derivatives. Disease rating was done as described in the legend to Figure 2. Tested strains are listed below each column, the numbers of infected plants (n) are given above each column, and the color and pattern code for disease rating is depicted on the right.
Figure 8.
Figure 8.
Expression of a Constitutively Active Allele of fuz7 Partially Bypasses the Need for Sho1 and Msb2. (A) The indicated SG200 derivatives were inoculated into maize seedlings. Prior to infection, either arabinose (to induce fuz7DD expression) or glucose (to repress fuz7DD expression) was added to the inoculums to a final concentration of 1%. Twelve days after infection, symptoms were scored as described in the legend to Figure 2. Inoculated strains and glucose/arabinose supplements are listed below each column, numbers of infected plants (n) are given above each column, and the color and pattern code for disease rating is depicted on the right. (B) Macroscopy and microscopy symptoms after infection with SG200Δsho1 Δmsb2 fuz7DD in the presence of glucose. A representative infected leaf is shown on the left 12 d after infection. Confocal microscopy performed as described in the legend to Figure 3A reveals poor colonization of plant tissue 6 d after infection (right panel). (C) Macroscopy and microscopy symptoms after infection with SG200Δsho1 Δmsb2 fuz7DD in the presence of arabinose. A representative infected leaf 12 d after infection is shown on the left. Confocal microscopy performed as described in legend to Figure 3A reveals strongly enhanced colonization of plant tissue 6 d after infection (right panel).
Figure 9.
Figure 9.
The Interaction of Sho1 and Kpp6 Influences Pathogenicity. (A) Wild-type kpp6, kpp6P130A P131A, and N-terminally truncated kpp6Δ1-169 were constitutively expressed as N-terminal Myc-fusion proteins in either SG200Δkpp6 or SG200Δsho1 Δkpp6. The SG200 derivatives listed below each column were inoculated into maize seedlings, and symptoms were scored 12 d after infection as described in the legend to Figure 2. (B) The indicated SG200Δkpp6- and SG200Δsho1 Δkpp6-derived strains were grown in liquid YEPSL to an OD600 of 1.0, and proteins were extracted and subjected to SDS-PAGE. After blotting, anti-Myc was used to detect Myc-Kpp6 as well as its mutated and truncated alleles (top panel). The Myc antibody detects with low signal intensity one unspecific cross-hybridizing protein at the size of Myc-Kpp6Δ1-169 that was disregarded. Tubulin served as loading control and was detected with antitubulin (bottom panel). The fusion proteins and tubulin are indicated by arrowheads on the right. The molecular mass marker is depicted on the left.

Similar articles

Cited by

References

    1. Aichinger C., Hansson K., Eichhorn H., Lessing F., Mannhaupt G., Mewes W., Kahmann R. (2003). Identification of plant-regulated genes in Ustilago maydis by enhancer-trapping mutagenesis. Mol. Genet. Genomics 270: 303–314 - PubMed
    1. Andrews D.L., Egan J.D., Mayorga M.E., Gold S.E. (2000). The Ustilago maydis ubc4 and ubc5 genes encode members of a MAP kinase cascade required for filamentous growth. Mol. Plant Microbe Interact. 13: 781–786 - PubMed
    1. Banuett F., Herskowitz I. (1989). Different a alleles of Ustilago maydis are necessary for maintenance of filamentous growth but not for meiosis. Proc. Natl. Acad. Sci. USA 86: 5878–5882 - PMC - PubMed
    1. Banuett F., Herskowitz I. (1994). Identification of fuz7, a Ustilago maydis MEK/MAPKK homolog required for a-locus-dependent and -independent steps in the fungal life cycle. Genes Dev. 8: 1367–1378 - PubMed
    1. Bechinger C., Giebel K.F., Schnell M., Leiderer P., Deising H.B., Bastmeyer M. (1999). Optical measurements of invasive forces exerted by appressoria of a plant pathogenic fungus. Science 285: 1896–1899 - PubMed

MeSH terms

Associated data

LinkOut - more resources