. 2010 Aug 15;21(16):2905-15.
doi: 10.1091/mbc.E10-06-0494. Epub 2010 Jun 29.

Mathematical modeling of endocytic actin patch kinetics in fission yeast: disassembly requires release of actin filament fragments

Affiliations

Mathematical modeling of endocytic actin patch kinetics in fission yeast: disassembly requires release of actin filament fragments

Julien Berro et al. Mol Biol Cell. .

Abstract

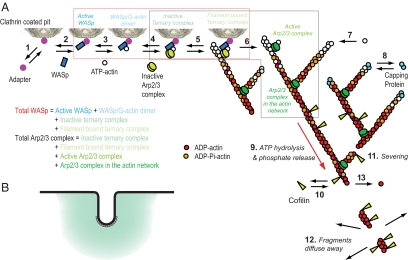
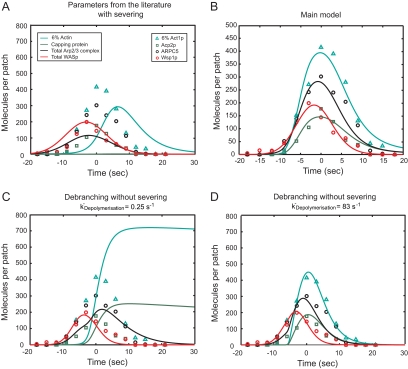
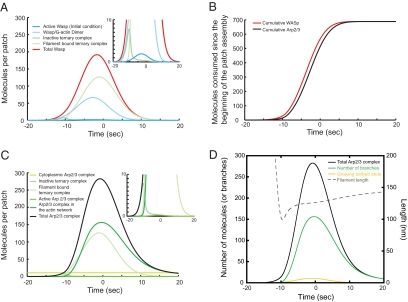
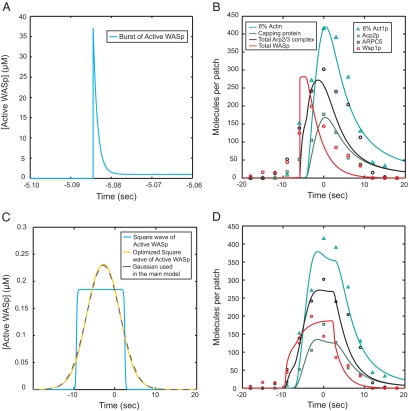
We used the dendritic nucleation hypothesis to formulate a mathematical model of the assembly and disassembly of actin filaments at sites of clathrin-mediated endocytosis in fission yeast. We used the wave of active WASp recruitment at the site of the patch formation to drive assembly reactions after activation of Arp2/3 complex. Capping terminated actin filament elongation. Aging of the filaments by ATP hydrolysis and gamma-phosphate dissociation allowed actin filament severing by cofilin. The model could simulate the assembly and disassembly of actin and other actin patch proteins using measured cytoplasmic concentrations of the proteins. However, to account quantitatively for the numbers of proteins measured over time in the accompanying article (Sirotkin et al., 2010, MBoC 21: 2792-2802), two reactions must be faster in cells than in vitro. Conditions inside the cell allow capping protein to bind to the barbed ends of actin filaments and Arp2/3 complex to bind to the sides of filaments faster than the purified proteins in vitro. Simulations also show that depolymerization from pointed ends cannot account for rapid loss of actin filaments from patches in 10 s. An alternative mechanism consistent with the data is that severing produces short fragments that diffuse away from the patch.


Figures

Figure 1.
Figure 1.
Diagram illustrating the reactions assumed in the mathematical model and simulations of actin filament assembly and disassembly at sites of endocytosis. (A) Numbered reactions in the model: 1, adapter binds clathrin; 2, Wsp1p binds adapter; 3, actin binds Wsp1p; 4, Arp2/3 complex binds Wsp1p (ternary complex); 5, inactive ternary complex binds filament; 6, filament activates ternary complex to initiate a branch; 7, ATP-actin elongates filament barbed ends; 8, capping protein blocks barbed ends; 9, actin hydrolyzes bound ATP and dissociates phosphate; 10, cofilin binds ADP-actin filaments; 11, filaments sever; 12, filament fragments diffuse away; and 13, ADP-actin subunits dissociate from free pointed ends. The red box encloses all WASp species in the model (Active WASp, dark blue; WASp/G-actin monomer, light blue; Inactive ternary complex, turquoise; Filament bound ternary complex, light green) for comparison with the amount of Wsp1p measured experimentally. The black box encloses all Arp2/3 complex species in the model (Inactive ternary complex, turquoise; Filament bound ternary complex, light green; Active Arp2/3 complex, green; Arp2/3 complex in the actin network, dark green) for comparison with ARPC5 measured experimentally. (B) A schematic diagram of actin network assembly at the site of endocytosis. Black line represents cell membrane, gray boxes represent clathrin at the tip of invagination, and teal represents actin network in a 300-nm sphere around endocytic invagination. The intensity of teal shading represents postulated gradient of density of actin network.
Figure 2.
Figure 2.
Comparison of experimental and simulated time courses of actin patch assembly and disassembly for the following species: simulated WASp (red curve); measured Wsp1p (red circles); simulated Arp2/3 complex (black curve); measured ARPC5 (black circles); simulated 6% of polymerized actin subunits (teal curve); measured 6% of Act1p (teal triangles); simulated capping protein (green curve); and measured Acp2p (green squares). (A) Simulation of the main model with parameter values measured in biochemical experiments and severing kChop at 0.25 μM−1 s−1. (B) Main model with optimized parameters from Tables 1 and 2. (C) Simulation with optimal parameters from the main model and dissociation of subunits from pointed ends at 0.25 s−1 but without severing and with Arp2/3 complex debranching kDebranch at 0.2 s−1. (D) Same as C but with kDebranch optimized to 0.3 s−1 and actin subunit dissociation rate from pointed ends at 83 s−1 to give the best fit with the experimental data without severing.
Figure 3.
Figure 3.
Time courses of protein species calculated in simulations of the main model. (A) WASp species. Color code for protein species: red, Total WASp; dark blue, Active WASp; light blue, WASp/G-actin dimer; turquoise, Inactive ternary complex; and light green, Filament bound ternary complex. (B) Accumulated numbers of WASp and Arp2/3 complex consumed during patch assembly, calculated as the integral of the rate of reaction 3 and 4, respectively. Color code for protein species: red, total WASp; black, total Arp2/3 complex. (C) Arp2/3 complex species. Color code for protein species: black, Total Arp2/3 complex; turquoise, Inactive ternary complex; light green, Filament bound ternary complex; green, Active Arp2/3 complex; and dark green, Arp2/3 complex in the actin network. (D) Number of actin filament ends and filament length. Color code for protein species: black, Arp2/3 complex; green, number of branches, also equal to Arp2/3 complex in the actin network: yellow, number of growing barbed ends; and gray dashed line, average length of branches calculated as the ratio of F-actin over the number of branches.
Figure 4.
Figure 4.
Effects of alternative assumptions for the accumulation and disappearance of active WASp on the simulated time courses. Color code for protein species: teal, actin; green, capping protein; and black, Arp2/3 complex. (A) All WASp molecules required for patch assembly are assumed to be activated suddenly in a burst and then consumed by the process. (B) Output of the simulation of the model with the driving function in (A) and the parameters from the main model in Table 1 except, kArpActivation+ + 0.41 s−1, kCap+ + 6.7 μM−1 s−1. (C) Model driven by rectangular pulse of activated Wsp1p. The blue curve is a square wave of activated WASp described by the equation, ActiveWASp + WASpMax 1/(1 + exp(−2k(t − timeON))) (1 − 1/(1 + exp(−2k(t − timeOFF))), with k + 5 s−1, WASpmax + 0.18 μM, timeON + − 9.4 s, and timeOFF + 2.5 s. The yellow curve is the result of optimizing the parameter k along with the other parameters for this function to give simulations with the best fit to the experimental time courses for Arp2/3 complex, actin and capping protein. The optimal parameters are k + 0.27 s−1, WASpmax + 0.29 μM, timeON + −6.9 s, and timeOFF + 1.3 s and give a time course for active WASp indistinguishable from the Gaussian used in the main model (gray dashed curve). (D) Output of the simulation of the model with the artificial square wave from C as the driving function and the parameters from the main model in Table 1.
Figure 5.
Figure 5.
Sensitivity analysis. The model was simulated with each parameter varied ± 1 order of magnitude to determine the sensitivity of the time course of actin accumulation and dispersal on parameter values. (A) Times of protein peaks. (B) Amplitudes of protein peaks. (C) Widths of protein peaks, defined as the difference between the times when the signal reaches 25% of its peak value during the assembly and during the disassembly. Color code for varied parameters: yellow dashed line, kWASpGBinding+; orange dotted line, kArpComplexFormation+; red dotted and dashed line, kARPGWBindingF+; brown plain line, kArpActivation+; dark blue plain line, kPolymerization+; blue dashed line, kCap+; light blue dotted line, kHydrolysis; light blue dotted and dashed line, kCOFBinding+; plain light green line, kChop. Parameters for the reverse reactions are not shown, because varying these parameters has little effect on the time courses of proteins in patches.

Similar articles

Cited by

References

    1. Achard V., Martiel J. L., Michelot A., Guerin C., Reymann A. C., Blanchoin L., Boujemaa-Paterski R. A “primer”-based mechanism underlies branched actin filament network formation and motility. Curr. Biol. 2010;20:423–428. - PubMed
    1. Andrianantoandro E., Pollard T. D. Mechanism of actin filament turnover by severing and nucleation at different concentrations of ADF/cofilin. Mol. Cell. 2006;24:13–23. - PubMed
    1. Beltzner C.C., Pollard T. D. Pathway of actin filament branch formation by Arp2/3 complex. J. Biol. Chem. 2008;283:7135–7144. - PubMed
    1. Blanchoin L., Pollard T. D. Mechanism of interaction of Acanthamoeba actophorin (ADF/Cofilin) with actin filaments. J. Biol. Chem. 1999;274:15538–15546. - PubMed
    1. Blanchoin L., Pollard T. D. Hydrolysis of ATP by polymerized actin depends on the bound divalent cation but not profilin. Biochemistry. 2002;41:597–602. - PubMed

Publication types

MeSH terms

LinkOut - more resources